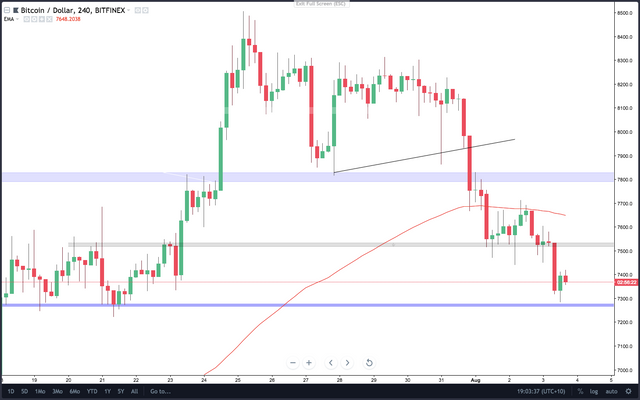
Today proved to be another difficult day for investors and traders as price was unable to push higher to retest the resistance of $7,800. Instead we saw price reject the 200ema at the $7,700 level and fall lower towards the support at $7,200. The weekends often have low volumes and far less movement then the week days so i am expecting prices to stay around the $7,250 - $7,400 area.
If we go down to the 4hr timeframe we can see the clear rejection price saw as it tested the 200ema, forming a strong bearish engulfing candle as soon as price touch this area. Today also saw price find its feet at the $7,250 region, i expect we could see prices fall to around the $7,200 later today and really testing the strength of this support level.

Very good analysis. Thank you for sharing.
Downvoting a post can decrease pending rewards and make it less visible. Common reasons:
Submit
If we can consolidatae at around 7200 and then go up again, it will be great. But I get the fealing many commentators are expecting Bitcoin to go to 6500 and then rebound. Which is also ok, as long as we don't go below 5900.
Downvoting a post can decrease pending rewards and make it less visible. Common reasons:
Submit
Very true. There is huge amounts of speculation that price will fall back to atleast $6,500 before we really begin the bull run which at this stage is very likely and definitely possible. Its going to be an interesting few weeks!
Downvoting a post can decrease pending rewards and make it less visible. Common reasons:
Submit