Thanks to ALL of you, Steemit is still alive, stabilizing and preparing for the next Bull Run !
We reached 12.2 mn visits in July 2019!
There is an important difference between total visitors to a site and unique ones. In this case the 12.2mn include the multiple times a person visited the website.
Therefore, as a good Steemian you probably connect everyday which will make you count for a total of 30 visits.
Therefore, how many “unique users” does Steemit has?
This is a very important question that I will try to answer later on. According to the Beta Analysis from the website I use to compile these datas, it is around 7mn (vs c.7.39mn in June) !
One quick word about the Methodology
Datas can come from multiple sources listed in the end of this post
These sources get their raw datas from companies working with them and sharing their datas in order to get access to competitor’s ones, browsers add-ons, in-app softwares which allow the Big Data to have a very large panel of users (north of 20mn) in order to statistically have the number of users/visits…
I use these raw datas to make excels tables, graphs…


In January 2018, we experienced the best daily numbers at 1.5mn+; they decreased a little under 1.5mn in February.
Unfortunately the daily traffic on Steemit slowed down to c.400 000 in December 2018. Let’s hope it is just a little setback
In April 2019, the average daily traffic was closer to 450k per day. In May it increased a little more.
Another, explanation could be that people spend more time on apps (Partiko, Steepshot, Dtube, Steemmonster, eSteem…) which are not accounted in this analysis.
Numbers are still low BUT it is stabilizing would be more accurate since January 2018 !
Steemit website is ranked 5,461 worldwide. In June, it was sitting at 5,316.
Steemit kept on deteriorating its ranking as it ranked 1400+ last year.
![image-8.png]
( )
)
Google Trends
Google Trend is an Indice based on 100, which means that 100 represents the week when most people searched for “Steemit” on Google.
Google Trends are still very low but there is hope as Bitcoin Google Trend is increasing slowly again, maybe more crypto users joining decentralized platforms?
Bitcoin Google Trend Graph
Steemit Traffic share by country

In the Top 5, the strongest traffic increase came from United-Kingdom with +5.07% visits!
![image-11-768x138.png]
( )
)
Mobile Traffic is increasing compared to last month as it represents 50.1% of the total
This is increasing as it was only c.42% in January 2019

August 2019
S M T W T F S
« Jul
1 2 3
4 5 6 7 8 9 10
11 12 13 14 15 16 17
18 19 20 21 22 23 24
25 26 27 28 29 30 31
Latest Media
No media
Steemit Statistics & Big Data: 🚀 End of July 2019 Update 🚀
August 7, 2019 (updated August 7, 2019) Published by mr.cryptolemon
Thanks to ALL of you, Steemit is still alive, stabilizing and preparing for the next Bull Run !
We reached 12.2 mn visits in July 2019!
There is an important difference between total visitors to a site and unique ones. In this case the 12.2mn include the multiple times a person visited the website.
Therefore, as a good Steemian you probably connect everyday which will make you count for a total of 30 visits.
Therefore, how many “unique users” does Steemit has?
This is a very important question that I will try to answer later on. According to the Beta Analysis from the website I use to compile these datas, it is around 7mn (vs c.7.39mn in June) !
One quick word about the Methodology
Datas can come from multiple sources listed in the end of this post
These sources get their raw datas from companies working with them and sharing their datas in order to get access to competitor’s ones, browsers add-ons, in-app softwares which allow the Big Data to have a very large panel of users (north of 20mn) in order to statistically have the number of users/visits…
I use these raw datas to make excels tables, graphs…
I] Traffic
Daily Steemit Traffic
In January 2018, we experienced the best daily numbers at 1.5mn+; they decreased a little under 1.5mn in February.
Unfortunately the daily traffic on Steemit slowed down to c.400 000 in December 2018. Let’s hope it is just a little setback
In April 2019, the average daily traffic was closer to 450k per day. In May it increased a little more.
Another, explanation could be that people spend more time on apps (Partiko, Steepshot, Dtube, Steemmonster, eSteem…) which are not accounted in this analysis.
Numbers are still low BUT it is stabilizing would be more accurate since January 2018 !
Steemit website is ranked 5,461 worldwide. In June, it was sitting at 5,316.
Steemit kept on deteriorating its ranking as it ranked 1400+ last year.
Google Trends
Google Trend is an Indice based on 100, which means that 100 represents the week when most people searched for “Steemit” on Google.
Google Trends are still very low but there is hope as Bitcoin Google Trend is increasing slowly again, maybe more crypto users joining decentralized platforms?
Bitcoin Google Trend Graph
Steemit Traffic share by country
In the Top 5, the strongest traffic increase came from United-Kingdom with +5.07% visits!
Mobile Traffic is increasing compared to last month as it represents 50.1% of the total
This is increasing as it was only c.42% in January 2019
This is useful to know how people use the Steem platform. Initiatives like @partiko (mobile app), @esteemapp (mobile app), @busy.org , @appics (Instagram), @actifit , @steemhunt , @utopian-io … will probably help the community to grow on mobile phones.
Be Careful with the Number of Visits
Also, remember that if you connect from a different device (home/work computer, mobile phone, tablet) you will count as a “new visitor” on each of these devices.
So as an example, let’s say you connected at home, at work and in the subway. You would represent 3 visits out of these 1mn+ Daily Visits.
!
7ohP4GDMGPrUMp8dW6yuJTR9MKNu8P8DCXDU9qmmksGusez1YzmgBNgANC3pAj3mojAhBxcqAY92TnYegNDTM39TGWL8ibUPqhY2.png
II] Marketing Mix
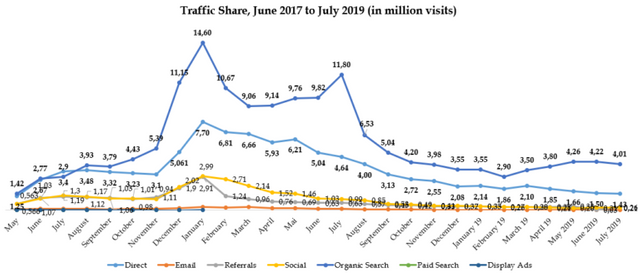
Organic Search is once again improving and represents 67,3% of the incoming Traffic.
Organic search is when people research on Google. As the number of quality bloggers on Steemit increase, our content has a higher probability of being listed in Google’s Top results.

Different Channels:
Direct: When you type in you Web browser www.steemit.com
Mail: When you connect to steemit.com through an e-mail link
Referrals: When you connect to steemit.com through a link found on another website (github…)
Social: When you connect to Steemit through a Facebook, Twitter, Instagram… page or link
Organic Search: When you type a search term like “Crypto” on Google and you click on one of the following steemit link proposed to you
Traffic Share Evolution since inception of this analysis

The Organic Search Strategy which means the Content Strategy is working as people come across Steemit looking for Crypto, Blog, Travel, etc… related articles.
Referring Social Pages

Youtube represented 35% of all the social platform incoming traffic. Reddit is also a strong source of new visits on the Steemit Platform. Last month, Facebook was the first Social Media to bring traffic to Steemit.com with a 32.4% contribution.
5 most searched terms on Google that leads to Steemit.com

To be honest, I don’t really get how some of these requests lead you to Steem but… it does.
What are Steemians main interests?

Gender Demographics

Age Distribution

III] Steemit website metrics

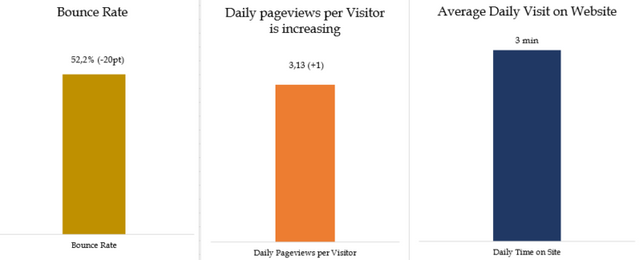
You feel a bit confused about these 3 metrics? Let me explain.
Bounce Rate is the % of people that leave the Website after just navigating on a single Webpage. The lower, the Better
Daily Pageviews per Visitor is the average number of pages a visitor opens. The Higher, the Better
Daily Time on Site is the full time a visitor spend on the website before closing the internet Webpage. The Higher the Better
Metrics improved a lot compared to last month, especially the Bounce rate and pageviews per visitor. I dot not really know how to explain it but it is quite positive. It means we have a sticky Steemian userbase that just WILL not let go ! 😀
My assumptions for July 2019
Total visits to Steemit.com: 12,2mn
Assumption of Total unique visitors in July: 6.5-7mn
Total Daily visitors: 350-370k
Assumption of Total Daily Unique visitors: 220-250k
This is a collective achievement and I would like to congratulate all of us! We need to do better and get back to the January 2018’s type of numbers.
This monthly report makes me very optimistic about STEEM’s future !
As you probably all followed, we have a new communication strategy. We have Steemit Inc. delivering on numerous fronts (including HF21). The community is continuing to build. Just look at our dapps ecosystem and the latest @steemmonsters guild release (app coming sooooon :D) or @actifit @steem-engine token !
We have so many projects that have matured, such an amazing Community and with Crypto prices bouncing we might have a chance to attract new users very soon!
Bring your friends, engage with fellow Steemians and make little Tribes !
Next BigData Analysis coming on @steemmonsters @drugwars and other cool projects !
Sources: Alexa, SimilarWeb, Google Trends…
👉 steemit 😍
Downvoting a post can decrease pending rewards and make it less visible. Common reasons:
Submit
Thanks for mentioning eSteem app. Kindly join our Discord or Telegram channel for more benefits and offers on eSteem, don't miss our amazing updates.
Follow @esteemapp as well!
Downvoting a post can decrease pending rewards and make it less visible. Common reasons:
Submit