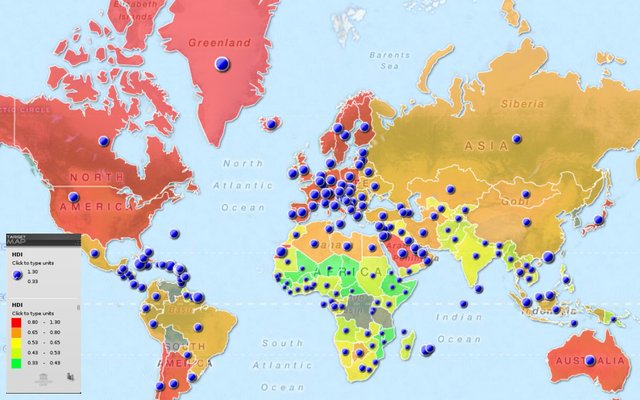
The human development index is certainly the precise tool to analyze our growth. I’ve taken 25 parameters and referring several authentic websites like wordldwatch.org & worldbank.org, I’ve given the following statistics. I hope it will be useful for everyone to understand how we progressed in the last century to chart our course in the remaining part of 21st century.
Population : From 1.6 billion in 1900 to 6 billion in 2000
No. of Independent Countries : From 53 in 1900 to 230 in 2000
Average Forest to land surface area ratio : from 7.5% in 1900 to less than 3 % in 2000
Average global temperature: 13.74 degree Celsius (56.71 F) in 1900 to 14.51 degree Celsius (58.12) in 2000
War related deaths: 123 to 125 million deaths due to war in the entire 20th century.
Number of satellites launched in 20th century: Nearly 1500 (in the entire 20th century)
Average World GDP figures : Around 4 % (weighted average for entire 20th century)
Military Spending of 20th century: World Average 4 % in 1900 (GNP) 2% in 2000 (GNP)
Spending on Education in 20th Century: 1.3 % of GDP to 6.4 of GDP in 2000
Percentage of illiterate people: 70 percent in 1900 to 25 percent in 2000
Spending on Health in 20th century (World Average): 0.3 % of GDP in 1900 to 6.5 % in 2000
The Growth of General Government Expenditure (Percentage of GDP): Around 13 % in 1900 to approx. 45 % in 2000
Average rate of inflation: Around 9 % in 1900 to 2.54 % in 2000
Co2 emission of 20th century: around 1304 Metric Tons in 1900 to 24000 Metric Tons in 2000
Loss of Bio-diversity in 20th century: 1 per cent of GDP per year
Extinction of species: 477 vertebrates disappeared in the 20th century out of 45000 known species
(that is slightly above 1 %).Life Expectancy ratio: roughly 35 to 40 years 1900 to around 70 years)
Human-rights related deaths in 20th century: around 70 to 75 million people
Number of migrant population in the world: 3 % in 1900 2.8 % in 2000
Average cost of military conflict in terms of GDP: 5 % of GDP (global weighted average)
Percentage of people who live below the poverty line (global weighted average):
Gender Inequality (in terms of women earning less than their male counterparts) : 17 % in 1900 to 7.5 % in 2000
Poor Health condition : 32 % in 1900 to 12 % in 2000
Malnutrition : 11 % in 1900 to 6.5 % in 2000
Indoor Air Pollution (GWP – Global Warming Potential) : 23 % in 1900 to Around 7 % in 2000
Data taken from: United Nations (Department of Economic and Social Affairs), World Resource Institute, International Organization for Migration, worldwatch.org & Worldbank.org
Book Reference : Public Spending in the 20th Century A Global Perspective
By Vito Tanzi & Ludger Schuknecht
Data Compiled by : Srini