The news based social media network, Twitter, is one of the primary resources of promotion for brands and businesses and it is not surprising that many companies are investing a huge portion of their time and money on Twitter analytics tools and metrics to analyze their performance on the platform.
Twitter analytics is a section of the Twitter platform that provides users with data and information about their presence quality on Twitter so that brands and businesses know where they are going.
Inosocial is another website that provides comprehensive Twitter analytics data for users and businesses
How to use Twitter analytics?
There are two types of Twitter analytics; Free and paid.
The free Twitter Analytics tool is embedded into Twitter’s website, which provides users with basic analytic metrics, sufficient for ordinary users and new, small businesses.
On the other hand, paid Twitter analytics programs to generate in-depth analytic data about a business’s activity on Twitter.
Inosocial is an example of an advanced Twitter analytics tool to which more and more businesses refer every day.
In this article, you will receive a comprehensive guide on both free and paid tools for Twitter analytics.
Inosocial Twitter Analytics
Inosocial social media analytics provides an all-in-one platform for Twitter, Facebook, Instagram, and YouTube analytics. In this article, we want to talk about Inosocial Twitter analytics separately, and break down each part of this tool to explain its performance.
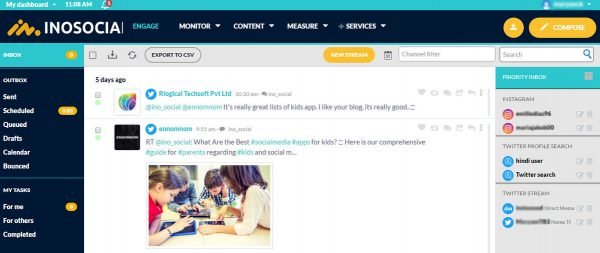
After you sign up to Inosocial and get your 7-days-free-trail, the page below will show up:
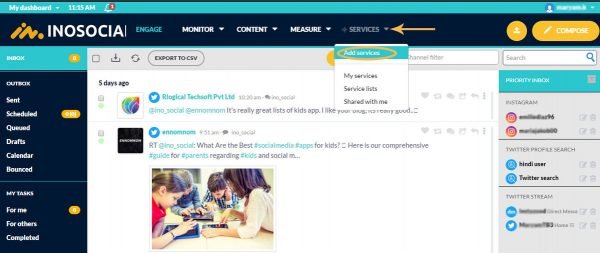
First of all, you need to add a Service to your dashboard. To do so, click on “Services”, “Add Services”:
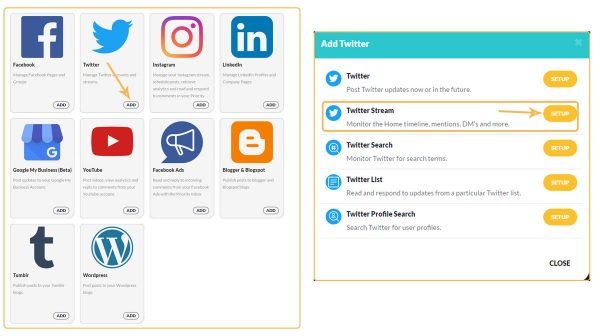
Now choose the platform (Twitter in this case) you want to measure, and pick “Twitter Stream”, and then, follow the on-screen instructions:
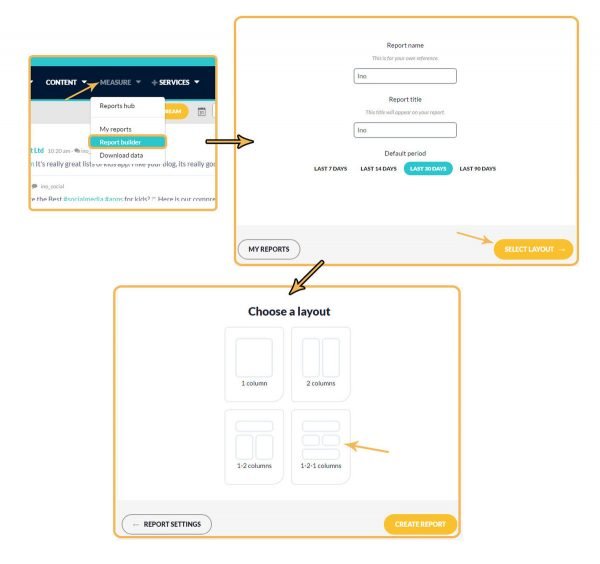
The account is now set up for Twitter. To go to the analytics session of Inosocial, click on the “measure tab,” “report builder”. Next, pick a name and title for the report and determine the period (LAST 7 DAYS, LAST 14 DAYS, LAST 30 DAYS, LAST 90 DAYS) and hit “Select layout”; the more the layouts, the more detailed your report will be (we choose the forth layout). Finally, hit “Create Report”.
Now it is time to add a module to the report. Here, the second tab “Channels” will let you choose each platform (YouTube, Facebook, Instagram, and Twitter) separately and build a report for each of them. All the services added to your dashboard are listed here. Scroll through them and find the Twitter account you want to get the analytics of (if you scroll down to the end of the list, you will see “all twitter accounts” option there. This option will give you a short summary of followers and followings count and your Twitter activity, which we are not going to choose):
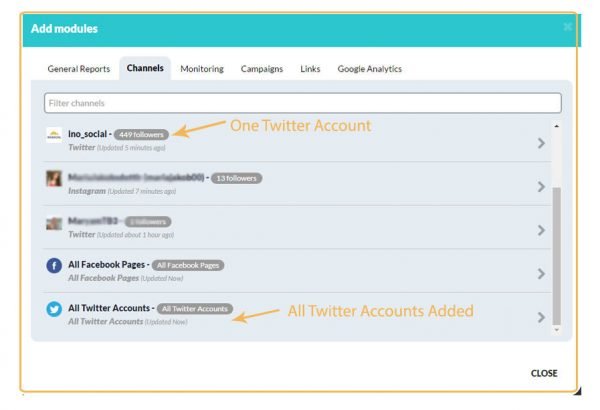
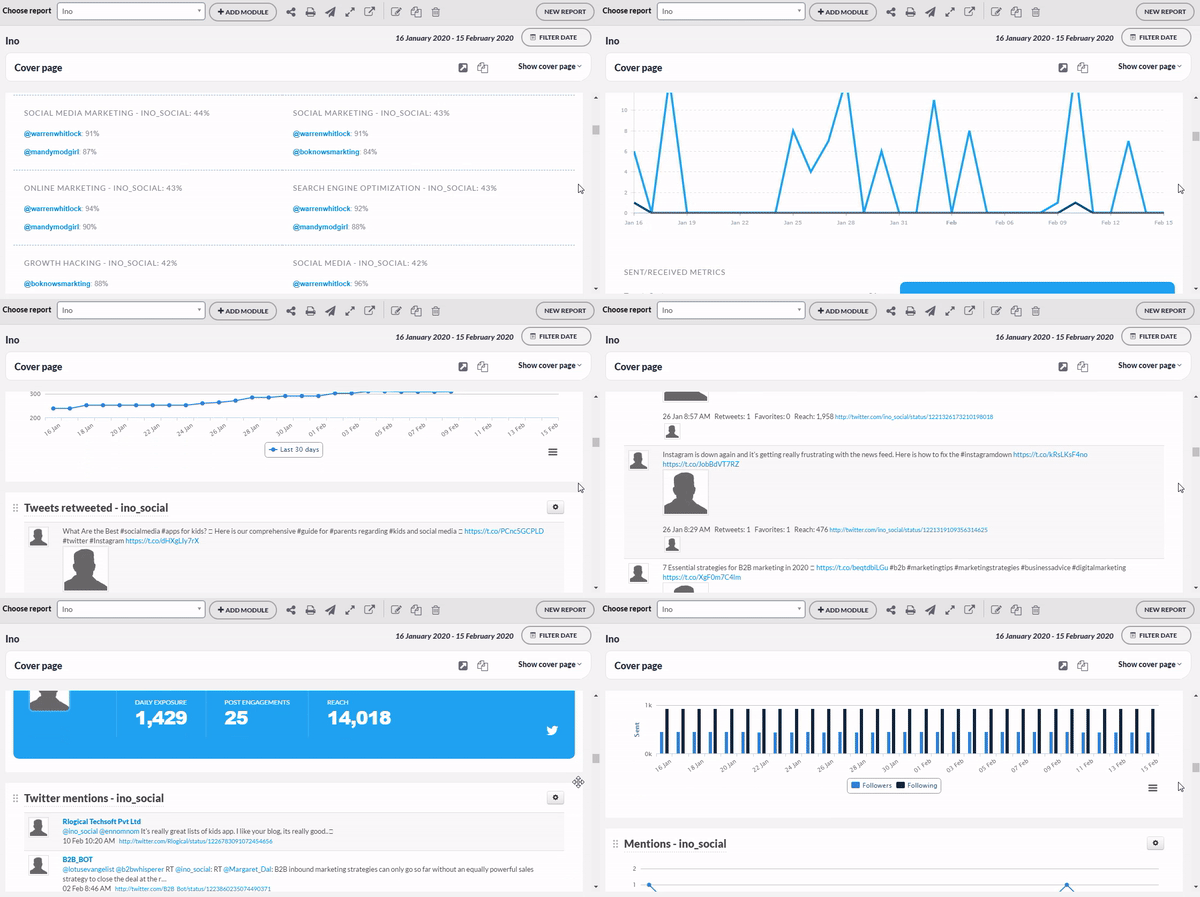
Next, you should choose what to be added to your report. You can choose any of the modules provided by Inosocial (up to 30 modules):
- Audience engagement
Breakdown of Mentions, Retweets, Likes, and Tweets sent over time.
- Audience growth
Daily follower growth on your Twitter channel.
- Best day to Tweet
A chart displaying the best day to Tweet. Measured by a probability of engagement.
- Best time to tweet
A chart displaying the best times to Tweet. Measured by a probability of engagement.
- Channel header
Channel header information.
- Content habits
Overview of posting habits on Twitter.
- DMs
DMs over time.
- Engaged users
A list displaying the most engaged audience members.
- Followers
Followers over time.
- Followers vs Following
Comparison of Followers versus Following.
- Following
The number of people being followed over time.
- Inbound message activity
The number of incoming posts, comments and messages received each day.
- Mentions
Mentions score over time.
- Mentions vs Retweets
Comparison of Mentions versus Retweets.
- Monthly tweets (cumulative)
The total number of tweets posted by month.
- Potential exposure
The size of the total potential audience reached. This includes followers of people that retweeted you.
- Recent followers
List of new followers and statistics.
- Response rates by date
Analyze your response rates by day on Twitter.
- Response rates by the hour
Analyze your response rates by hour on Twitter
- Response rates by weekday
Analyze your response rates by weekday on Twitter.
- Retweets
Retweet score over time.
- Sentiment
Sentiment over time.
- Summary
A summary of tweets, retweets, mentions, and followers for the selected period.
- Summary (3 months)
A summary of tweets, retweets, mentions, and followers for the past 3 months.
- Task completion rate
Analyze your task completion rates.
- Top 5 Tweets
List of your most popular Tweets.
- Topics & influencers
The most popular topics amongst your followers.
- Tweets
An overview of Tweets sent and replies received over time.
- Tweets
Tweets created over time.
- Tweets retweeted
Retweets and statistics.
- Twitter activity overview
A summary of Daily Exposure, Post Engagements and Reach.
- Twitter mentions
Mentions and statistics.
- Workflow activity
The number of tasks assigned or completed from incoming posts, comments or messages each day.
Twitter’s free analytics
To access the free analytics of Twitter, on the main page, left menu column, click on “More” and then “Analytics”. Now you will be directed to the analytics page of Twitter. Twitter’s analytics consists of three tabs (it was previously 5 tabs): “Home” tab, “Tweets” tab and “More” drop-down menu. Let’s start with “Home”.
Twitter’s analytics Home tab:
Here four of your most important Twitter metrics are listed at the top, with statistics of 28-days-period: Tweets, Tweet impressions, Profile visits and Followers.

- Tweets are all the posts published during this period by this account (which had a 107.1% increase compared to the previous 28-days-period);
- Tweet impressions show the number of times users saw the tweets of this account on Twitter during the past 28 day (which is 14.200 times);
- Profile visits tell us how many people have headed to this Twitter page; and
- Followers show the total number of followers this account has got on Twitter.
Scrolling down, you will see separate statistics for each month of your Twitter activities:
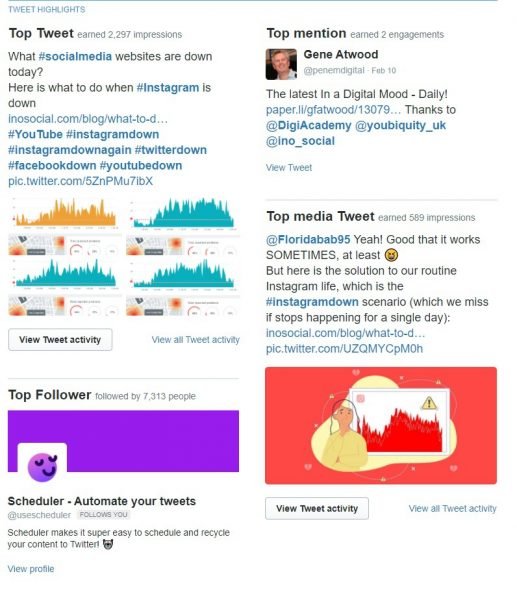
Twitter’s analytics Tweets tab:
Here you can see:
- your Twitter’s activity diagram in a 28 days period (the period can be adjusted manually):
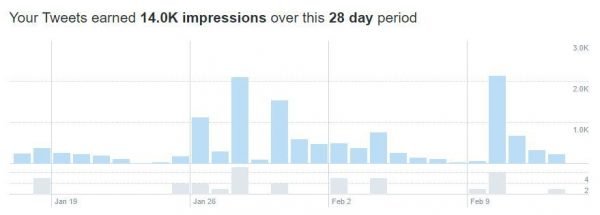
Separate tweets’ statistics

Engagements, showing 28 days (or any adjusted period of time) with daily frequency

Twitter’s analytics More tab:
This tab gives you analytic metrics about your videos and conversion rate to your website. If you have a website, this is a great way to see how your audience is trafficking between the website and your Twitter page.
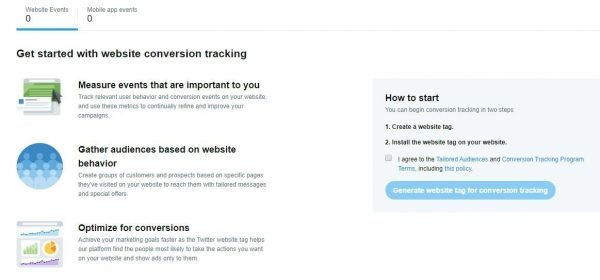
To start, create a website tag and install the tag on your website.
Over to you
Twitter analytics is necessary for brands and businesses if they are going to experience significant growth in their social media. Inosocial is a tool for every small and medium-sized business on their way to growing social media marketing and management. We have Analytics for Instagram, YouTube, and Facebook, which can be aligned with Twitter analytics in a single report. In addition, monitoring and scheduling tools of Inosocial are quite handy if you wish to try them in 7 days of a free trial.
Source: https://inosocial.com/blog/a-comprehensive-guide-to-twitter-analytics-tools-2020/