미국증시 (S&P 500) 는 1월달까지 (무려 5.6% 상승함) 잘나가다가 2월달에 들어와서 높은 임금인상률이 발표되면서 ( 작년 대비 2.9%) 연준이 올해 4번에 걸쳐서 금리인상할것이라는 두려움이 금융시장를 덮치고 주식시장은 무력 10% 가까이 하락하면서 (정확히 8.6% ) 주식시장이 드디어 베어마컷 모드로 들어갔느냐하면서 여러 의견들이 니왔습니다.
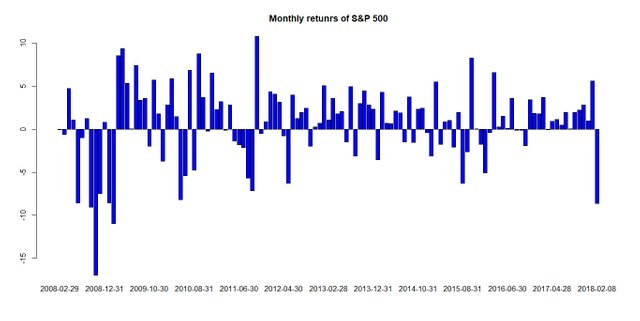
저의 개인적인의견은 조정에 들었가는데 그조정이 다음달 3월까지는 변동성이 좀더 길게 지속될수가 있다는점입니다. 그동안 미국증시는 거의 2016년 11월달이후부터 제대로 된 조정를 경험한적이 없습니다. 3월에 아주 미미한 조정을 겪은이후에 거의 10개월 가까이 상승했으며 특히 1월에 5.6% 의 상승를 경험했습니다. 이것은 지난 10년동안 매달 평균 0.65% 의 상승률에 비해서 아주 높은 상승률을 한것입니다. 아래차트를 보면 주가는 몇달을 상승하면 반드시 조정을 겪습니다.
The fear finally attacks the U.S. financial markets because that the Fed would raise interest rates four times this year as the wage increased at 2.9% in January compared to last year. The stock market (S&P 500) has fallen by nearly 10% (exactly 8.6%), and the stock market has finally entered the correction mode.
My personal opinion is that the correction would last a little longer until March or longer because the US stock market has not undergone proper correction phase since November 2016. This is almost 13 straight months. It has risen nearly 10 months straight since the very minor or small correction happened in March. The stock market went up a 5.6% increase in January which is very unusual high return. This is a very high rate of increase compared to an average rate of the stock market which is 0.65% per month. Looking at the chart below, the stock market went through corrections after Increases in several months.

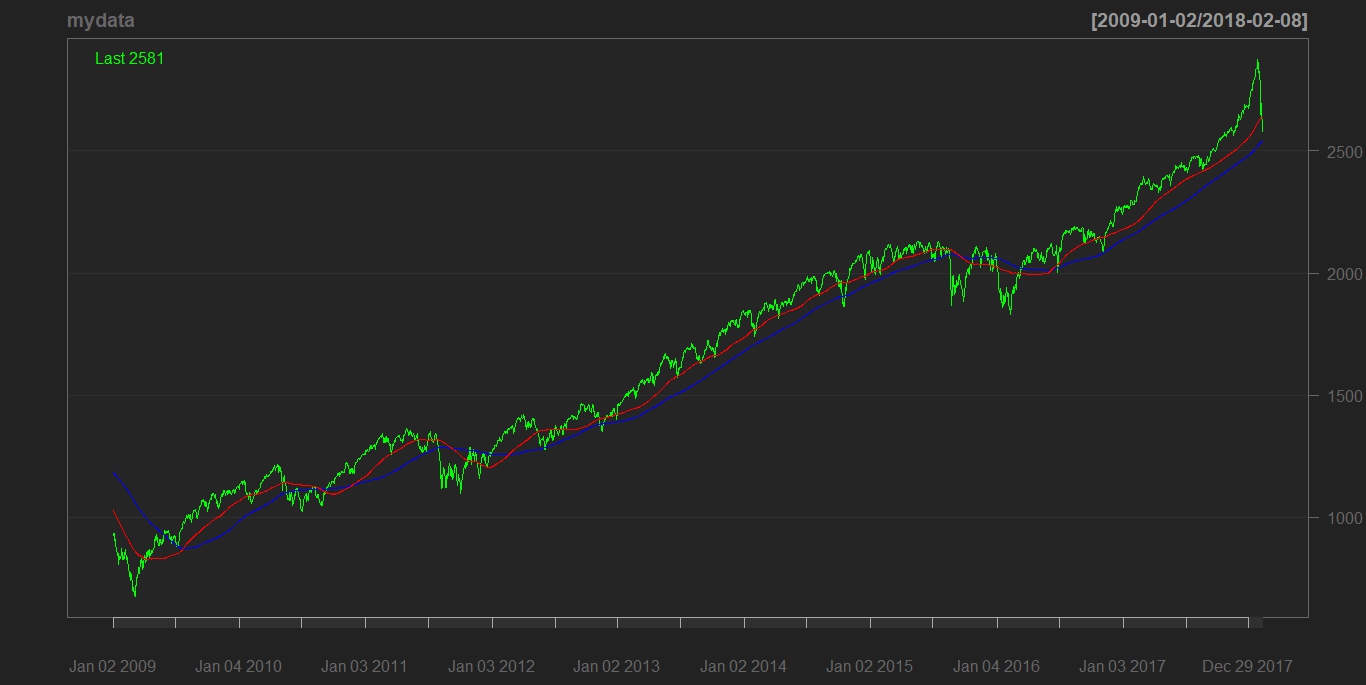
현재 주가는 2,581 (2/8/2018)인데 200일 평균이동선(파란선) (2,520) 보다는 높고 100일 평균이동선 (빨강선) 보다는 낮습니다. 만약 주가가 200일 평균이동선 (파란선) 을 뚫고 하락한다면 걱정할만하지만 아직은 패닉할만하지는 않습니다. 아래 차트를 봐도 지난 2달동안 주가는 빠르게 너무높게 상승할것을 볼수가 있습니다. 그래서 이번조정은 필연적이었던것이었습니다.
The current S&P 500 is 2,581 as of 2/8/2018, which is higher than the 200-day moving average line (blue line) (2,520) and lower than the 100-day moving average line (red line). If the stock price drops below the 200-day moving average line (blue line), it's worrying, but it's not panic yet. Looking at the chart below, we can see that stock prices rose very quickly for the past two months so the correction was inevitable.

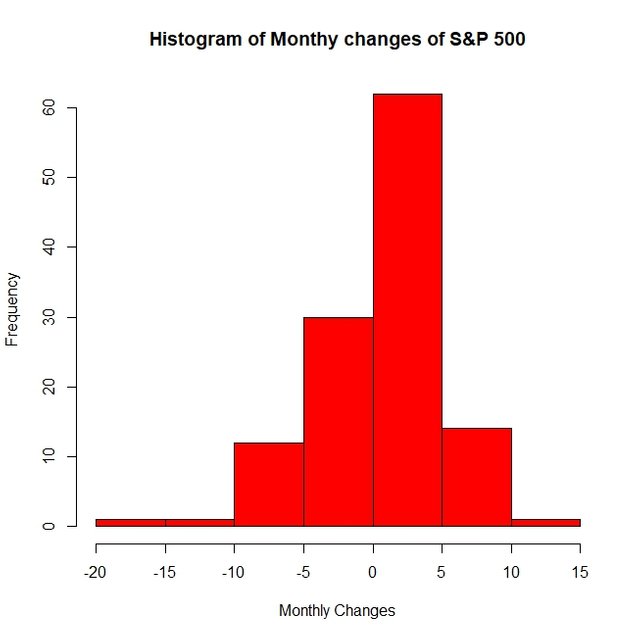
아래차트는 금융위기 이후의 월평균 (월평균 상승률은 0.6%)
