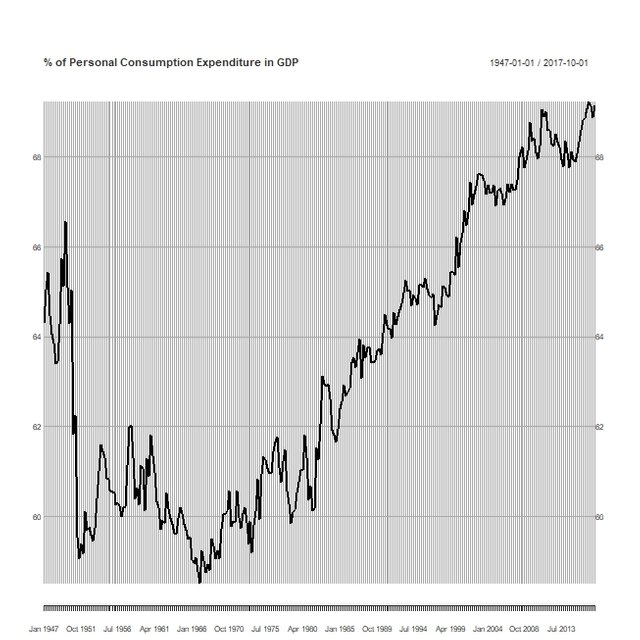
미국의경제는 1980년 대이후 소비위주의 국가로 점점 변해지고 있습니다. 1980년 이전에는 소비가 전체규모의 60% 정도 차지했지만 이부분이 점점 늘어나서 현재는 69% 가량 차지하고 있습니다. 저축은 적게하고 소비가 늘어난경우이지요. 또한 이기간동안 미국의 금리도 서서히 하락하면서 소위 빚을 권하는사회 즉 신용이 팽창했습니다. 주택을 담보로 손쉽게 은행으로 부터 론을 얻을수가 있었습니다.
The US economy has been changing into consumption-oriented economy ever since the 1980s. Prior to 1980, consumption accounted for about 60% of the total economy, but this portion has been increasing and now accounts for 69% of total economy. People save less and consume more. The interest rate of the United States gradually declined during this period, and the U.S economy becomes debt advocacy society while credit was expanded. People could easily get loans from the banks with the mortgage.
[Personal Consumption.jpeg]
소비가 전체 경제규모에서 자지하는 부분이 높아져가고 있습니다. 그런데 1980년 이후 실질임금은 정체되어있습니다.
The portion of consumption in whole economy is increasing. However, real wages have stagnated since 1980.
( )
)
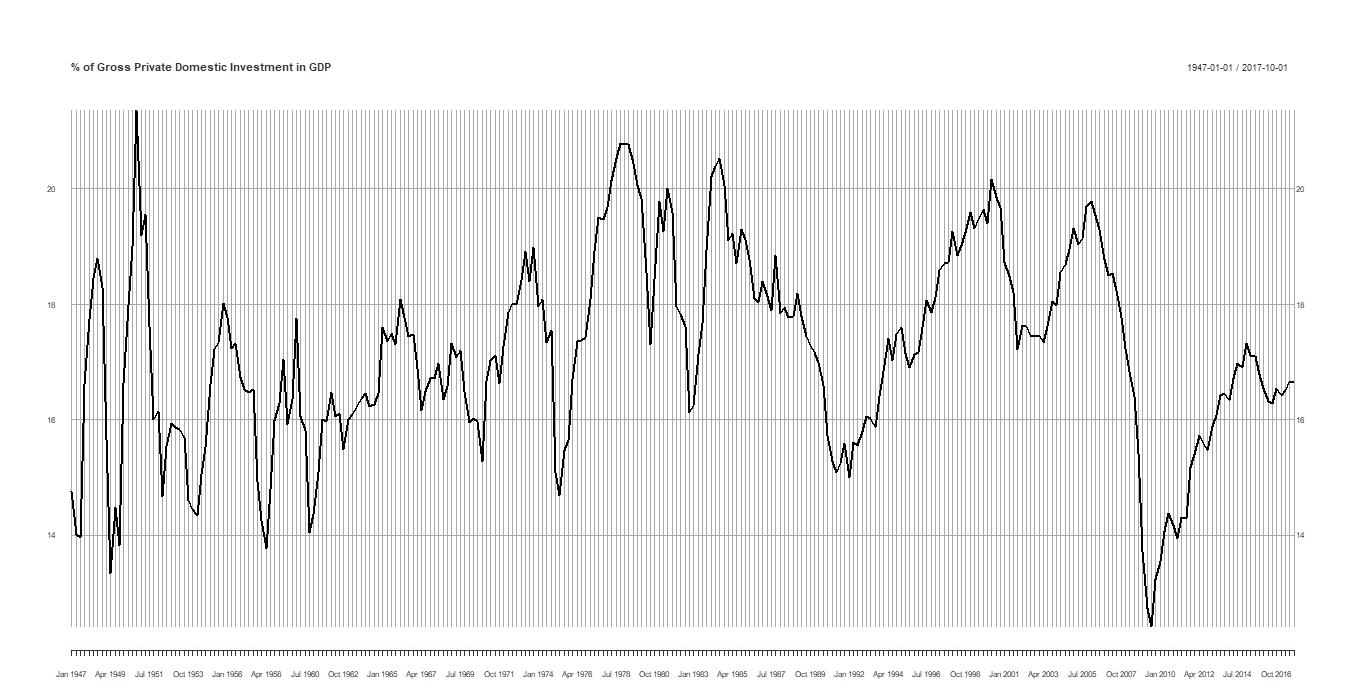
아래 차트는 민간투자가 차지하는 부분인데 현재 16.3% (2017년 4분기 기준) 으로 역사적 평균 아직도 낮은편입니다.
The chart below shows the portion of private investment, which is currently 16.3% (as of 4Q08), which is still historically low
 ![Net Export.jpeg]
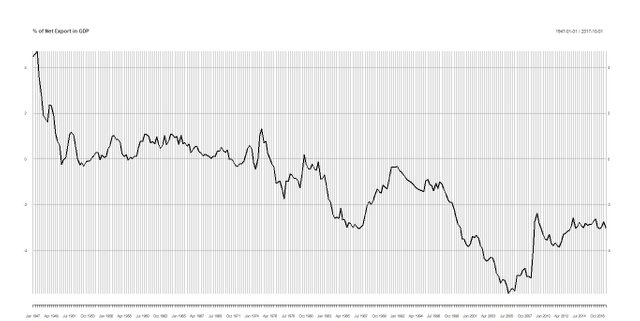
아래는 미국의 무역적자가 전체경제 규모에서 차지하는 분야입니다. 현재 전체 경제에서 2.6-3.0 % 차지 하고 있습니다. 트럼프 대통령은 약달러로 미국의 일자리를 늘리려는 정책을 펼치고 있습니다.
Below is the US trade deficit in the overall economy. At present, it accounts 2.6-3% of the economy accounts. Trump is pursuing a trade policy of increasing US jobs by weakening U.S. dollars.
( )
)
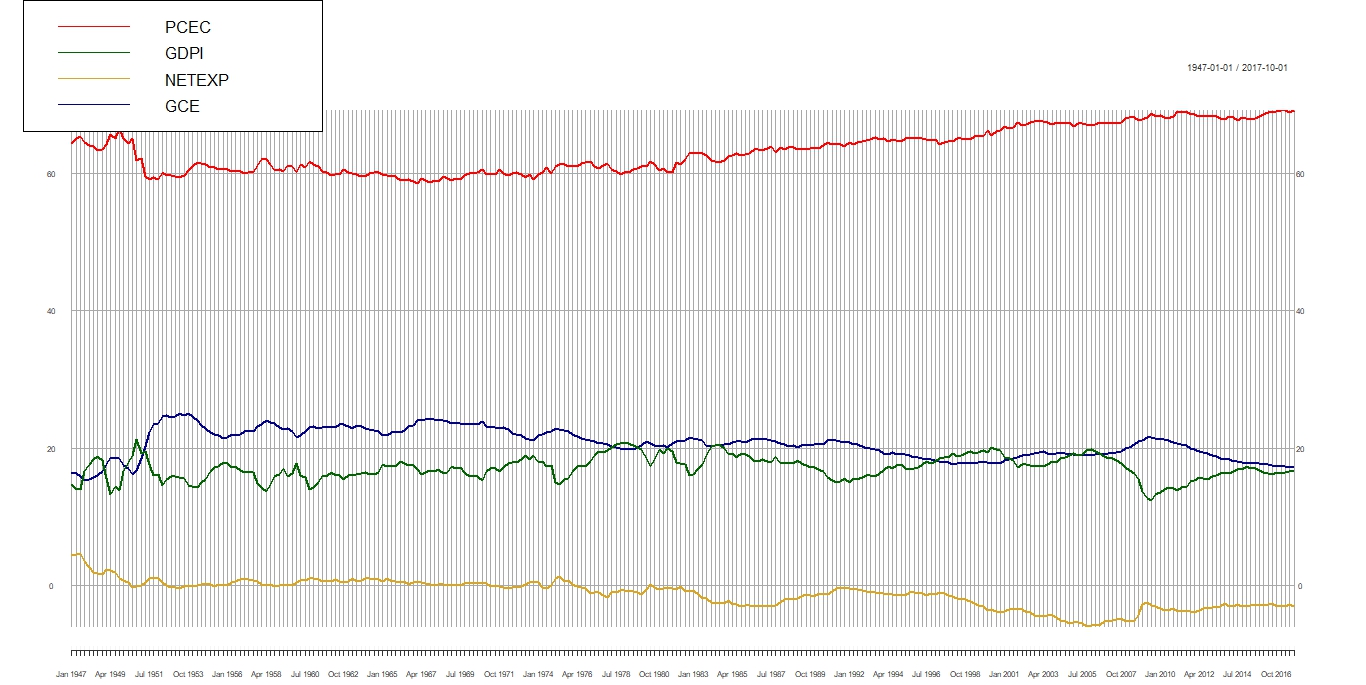
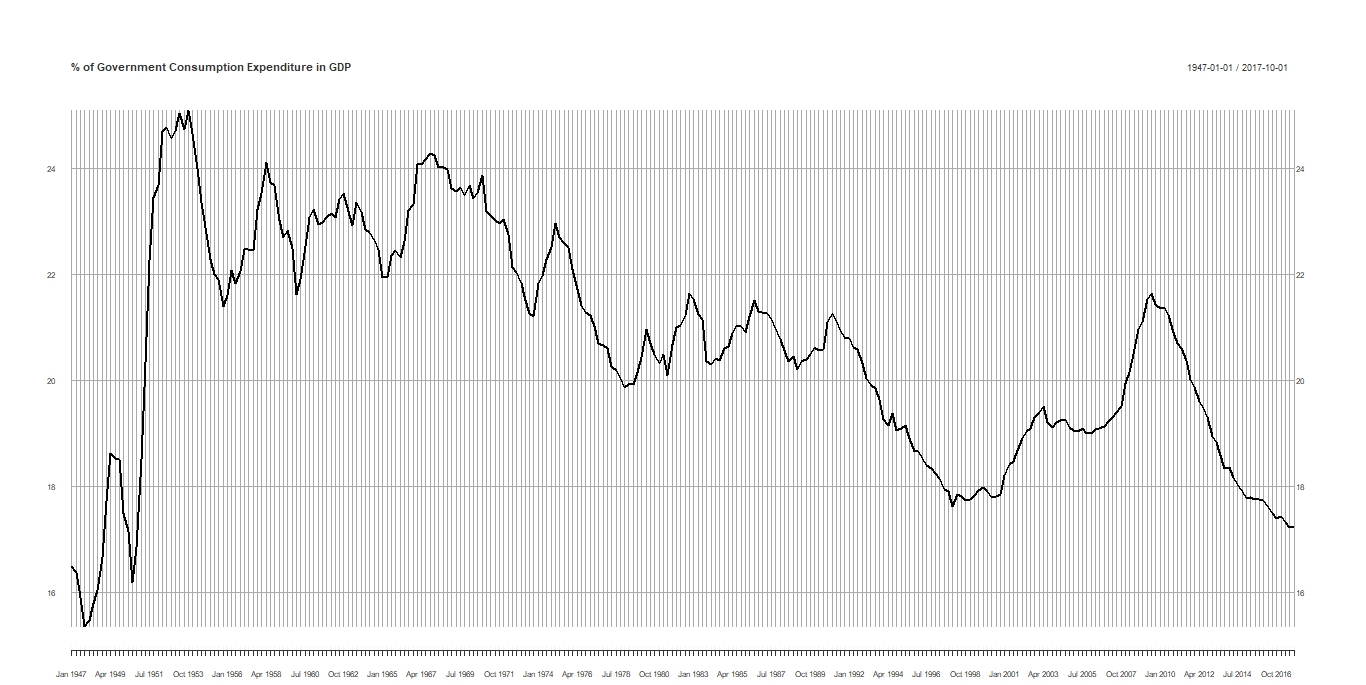
정부지출이 전체경제에서 차지하는 부분입니다. 평균적으로 21% 인데 금융위기때 정부지출이 치솟다가 서서히 하락하면서 현재는 17.5% 정도 차지하고 있습니다.
The following chart shows the government spending portion of the overall economy. On average, it is 21%. the Government spending has soared in the financial crisis, but it has fallen slowly and now accounts for 17.5% of total economy.
The following R codes would generate the charts above:
library(tseries);library(timeseries);library(xts);library(forecast)
library (quantmod)
library(psych)
library(plotly) #install.package(plotly)
getSymbols(c('GDPDEF','GDP','PCEC','GPDI','NETEXP','GCE'), src='FRED')
ratio_PCEC=PCEC/GDP100
ratio_GPDI=GPDI/GDP100
ratio_NETEXP=NETEXP/GDP100
ratio_GCE=GCE/GDP100
basket<-cbind(ratio_PCEC, ratio_GPDI, ratio_NETEXP, ratio_GCE)
summary(basket)
tail(basket)
myColors <- c("red", "darkgreen", "goldenrod", "darkblue")
plot(x = basket, xlab = "Year", ylab = "Percent",
main = "Percent in GDP", col = myColors, screens = 1)
legend(x = "topleft", legend = c("PCEC", "GDPI", "NETEXP", "GCE"),
lty = 1, col = myColors)
describe(ratio_GPDI)
plot(ratio_PCEC, main="% of Personal Consumption Expenditure in GDP", ylab="Percent")
lines(mean_PCEC, col='red')
plot(ratio_GPDI, main="% of Gross Private Domestic Investment in GDP")
plot(ratio_NETEXP, main="% of Net Export in GDP")
plot(ratio_GCE, main="% of Government Consumption Expenditure in GDP")