In the past posts, we learned how to create simple line symbol. But we did not use any parameters creating simple line symbol. Today, i will describe how to customize simple line symbol.
What Will I Learn?
We will learn how to customize simple line symbol.
- How to create polyline.
- How to create color.
- How to create simple line symbol.
- How to customize simple line symbol.
- How to create graphic.
- How to add graphic to map.
Requirements
You can use any operating system and any ide or editor. I will use "Windows PC" and "Visual Studio Code". And i will use ESRI ArcGIS JS Library from web. But you can install library using bower from github repository.
- Windows 10 Operating System
- Visual Studio Code Editor
- ESRI ArcGIS JS API version 3.23
- Basic knowledge of HTML
- Basic knowledge of JS
- Basic knowledge of CSS
- Basic knowledge of Dojo Toolkit
Difficulty
- Basic
Contents
1. File Schema
| -- ESRI ArcGIS JS API 3.23
| -- | -- js
| -- | -- | -- main.js
| -- | -- css
| -- | -- | -- main.css
| -- | -- fonts
| -- | -- | -- font-awesome-4.7.0
| -- | -- | -- | -- css
| -- | -- | -- | -- |-- font-awesome.min.css
| -- | -- | -- | -- fonts
| -- | -- | -- | -- less
| -- | -- | -- | -- scss
| -- | -- index.html
*Only used files in project has been shown. There are other files for dependency.
2. Create Polyline
Firstly we will create polyline using ESRI ArcGIS JS API "Polyline" library to show custom simple line symbol. We learned how to create polyline in previous post. So i will describe shortly. We will work in "main.js" file.
2.1 Add Polyline Library and Create Polyline Instance
We will add polyline library using require method.
require([
   "esri/geometry/Polyline"
], function (
    Polyline
){...});
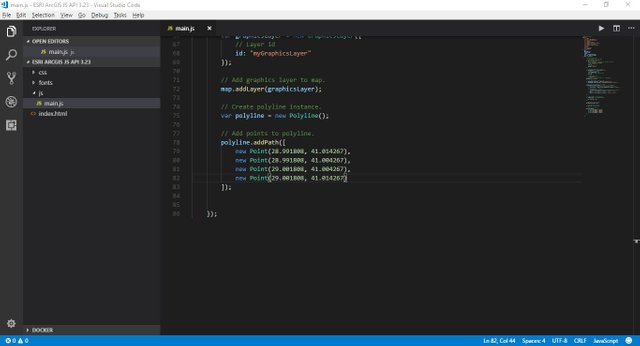
Now, we can create polyline instance and add points using addPath method.
var polyline = new Polyline();
polyline.addPath([
            new Point(28.991808, 41.014267),
            new Point(28.991808, 41.004267),
            new Point(29.001808, 41.004267),
            new Point(29.001808, 41.014267)
]);
3. Create Custom Simple Line Symbol
We will create custom simple line symbol using ESRI ArcGIS JS API "SimpleLineSymbol" library.
3.1 Add Simple Line Symbol Library
We will add simple line symbol library using require method.
require([
  "esri/symbols/SimpleLineSymbol"
], function (
    SimpleLineSymbol
){...});
3.2 Create Simple Line Symbol Instance
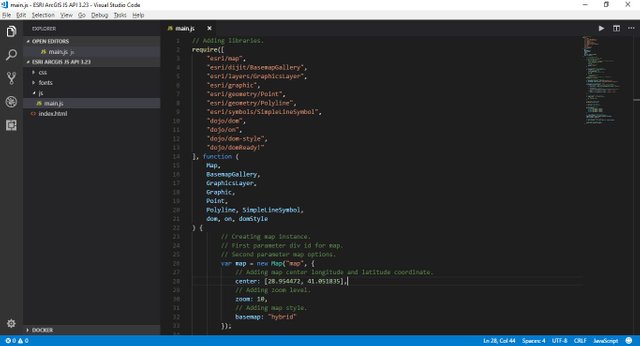
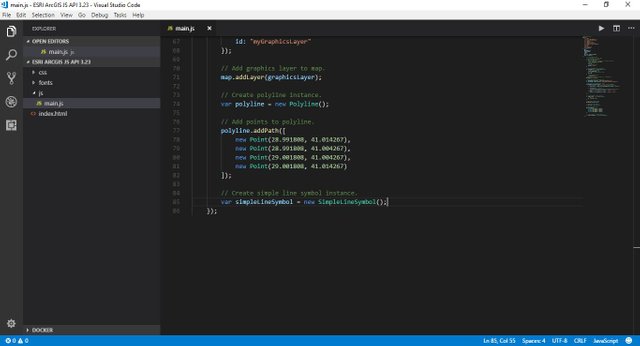
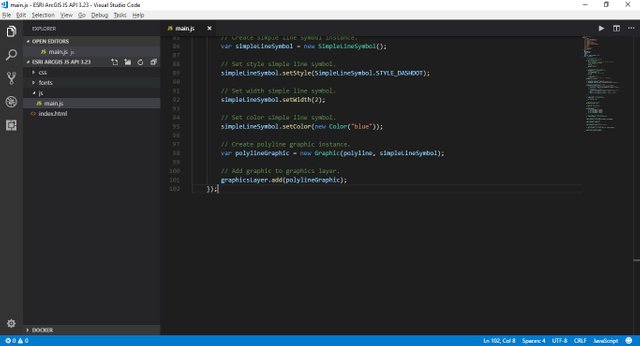
We will create new symbol instance. We will not use any parameters. We will use "setStyle", "setWidth" and "setColor" methods to customize simple line symbol.
var simpleLineSymbol = new SimpleLineSymbol();
3.2.1 Set Style Simple Line Symbol Instance
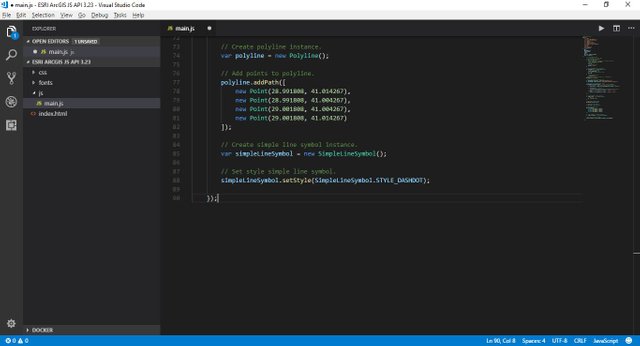
We can use line geometry as dash, solid or dot shaped. We can use setStyle method to change line type. setStyle method has one parameter that is line type. It can be SimpleLineSymbol.STYLE_DASH etc. We will use "SimpleLineSymbol.STYLE_DASHDOT" for this example. You can look over ESRI Simple Line Library for other types.
simpleLineSymbol.setStyle(SimpleLineSymbol.STYLE_DASHDOT);
3.2.2 Set Width Simple Line Symbol Instance
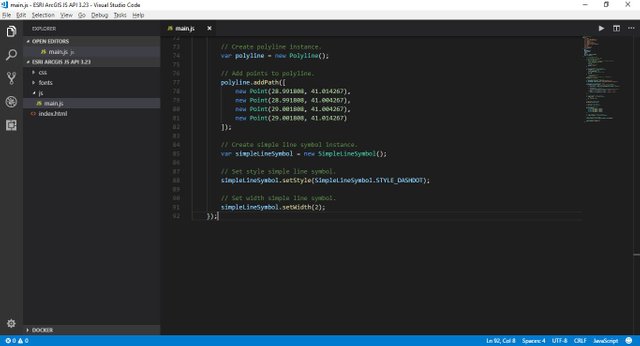
We can use setWidth method to change width line geometry. setWidth method has one parameter that is integer. We will use 2 for this example.
simpleLineSymbol.setWidth(2);
3.2.3 Set Color Simple Line Symbol Instance
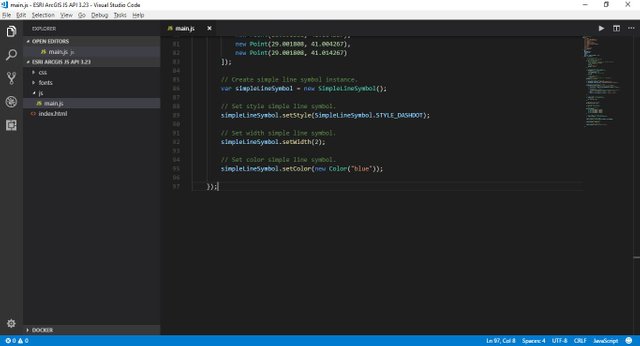
We can change color our line geometry using setColor method. setColor method has one parameter that is color object. We will create color object using ESRI Color library. I will describe briefly but we will learn how to create color object using different ways in future post. We will use blue color in this example.
We will add color library using require method.
require([
  "esri/Color"
], function (
    Color
){...});
Now, we can change color of line geometry using setColor method.
simpleLineSymbol.setColor(new Color("blue"));
4. Create Graphic Instance And Add To Map
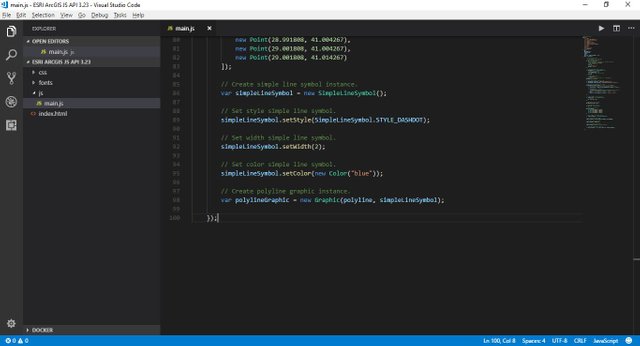
We learned how to create graphic previous post. We will create new graphic instance using two parameters. First parameter is geometry for this example it will be our polyline. And second parameter is symbol for this example it will be our custom simple line symbol.
var polylineGraphic = new Graphic(point, simpleLineSymbol);
Now, we can add polyline graphic to graphics layer using add method.
graphicsLayer.add(polylineGraphic);
5. Result
We can see the result by running the "index.html" file.
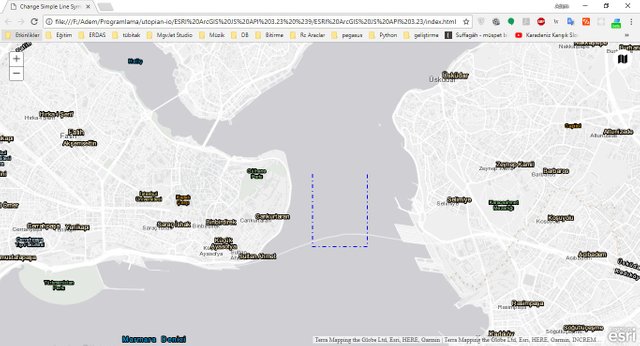
We learned how to create and customize simple line symbol and add to map using ArcGIS JS API and Dojo in web.
Thank you for your attention and see you next time!
Curriculum
You can view old post below links.
- #01 - Create Map With Esri ArcGIS JS Api
- #02 - Add Basemap Gallery on Map With Esri ArcGIS JS Api
- #03 - Change Basemap Gallery Style on Map With Dojo Toolkit
- #04 - Add Graphics on Map With Esri ArcGIS JS Api
- #05 - Create Point With Esri ArcGIS JS Api
- #06 - Create Polyline With Esri ArcGIS JS Api
- #07 - Create Polygon With Esri ArcGIS JS Api
- #08 - Create Circle With Esri ArcGIS JS Api
Source
Posted on Utopian.io - Rewarding Open Source Contributors
Your contribution cannot be approved because it does not follow the Utopian Rules.
Violated Rule:
Tutorials must be technical instructions that teach non-trivial aspects of an Open Source project.
Design or video editing related tutorials, gameplay, simple on-screen instructions, ubiquitous functions (Save, Open, Print, etc.) or basic programming concepts (variables, operators, loops, etc.) will not be accepted.
My Opinion:
A tutorial must be informative and explanatory, but also "tutor". This tutorial lacks "tutor"ing, and it is nothing more than an explanation of a documentation.
Trivial programming concepts.
This is not an open-source project. Here is their license. It does not match the definition of open source.
You can contact us on Discord.
[utopian-moderator]
Downvoting a post can decrease pending rewards and make it less visible. Common reasons:
Submit