What Will I Learn?
- How to make simple Linear Model
- How to Load Data
- TensorFlow Graph
- How to run TensorFlow
- Performance before any optimization
- Performance after 1 optimization iteration
- Performance after 10 optimization iterations
- Performance after 1000 optimization iterations
Requirements
- Python3
- Jupyter Notebook
- TensorFlow package
- Intermediate Python3
Difficulty
- Intermediate
Tutorial Contents
This is a tutorial on TensorFlow where we will make a simple linear model, it is assumed that you are familiar with basic linear algebra, such as matrix multiplication, and that you are familiar with Python programming, and the Jupyter Notebook editor.
Imports
We will use matplotlib to show plots and tensorflow and numpy and then we will use the confusion_matrix from sklearn.
In [1]:
%matplotlib inline
import matplotlib.pyplot as plt
import tensorflow as tf
import numpy as np
from sklearn.metrics import confusion_matrix
Load Data
First we'll load the MNIST data-set it is about 12 MB and if you don't have it already it will be downloaded automatically you can set the path the data-set here data/MNIST/
In [2]:
from tensorflow.examples.tutorials.mnist import input_data
data = input_data.read_data_sets("data/MNIST/", one_hot=True)
Extracting data/MNIST/train-images-idx3-ubyte.gz
Extracting data/MNIST/train-labels-idx1-ubyte.gz
Extracting data/MNIST/t10k-images-idx3-ubyte.gz
Extracting data/MNIST/t10k-labels-idx1-ubyte.gz
In [3]:
print("Size of:")
print("- Training-set:\t\t{}".format(len(data.train.labels)))
print("- Test-set:\t\t{}".format(len(data.test.labels)))
print("- Validation-set:\t{}".format(len(data.validation.labels)))
Size of:
- Training-set:     55000
- Test-set:     10000
- Validation-set:   5000
The data-set consists of 70,000 images and it has been divided into a training-set with 55,000 and a test-set with 10,000 and a validation-set with 5000. We don't use the validation-set in this example
One-Hot Encoding
In [4]:
data.test.labels[0:5, :]
Out[4]:
array([[ 0.,  0.,  0.,  0.,  0.,  0.,  0.,  1.,  0.,  0.],
       [ 0.,  0.,  1.,  0.,  0.,  0.,  0.,  0.,  0.,  0.],
       [ 0.,  1.,  0.,  0.,  0.,  0.,  0.,  0.,  0.,  0.],
       [ 1.,  0.,  0.,  0.,  0.,  0.,  0.,  0.,  0.,  0.],
       [ 0.,  0.,  0.,  0.,  1.,  0.,  0.,  0.,  0.,  0.]])
When we load the data-set we said one_hot=True which means that it is loaded as one-hot encoded. This means that the label of each sample in the data-set is a vector for the number of classes in this case 10 and all the numbers in each vector in each row in this matrix shown here are 0 except for the class number in this case it is 7.
And in the 2nd row the class is 2 and in the 3rd row the class is 1 and the 4th row the class is 0 and in the 5th row the class is 4
we also need the class numbers as regular numbers so we calculate that here
In [5]:
data.test.cls = np.array([label.argmax() for label in data.test.labels])
and we can show them here.
In [6]:
data.test.cls[0:5]
Out[6]:
array([7, 2, 1, 0, 4])
For the five samples shown above the classes are again 7, 2, 1, 0, 4 and this corresponds to the One-Hot encoded vectors
Data dimensions
here we define some variables or constants for the data dimensionality and the images in MNIST are 28 by 28 pixels and there are 10 classes one for each digit
In [7]:
# We know that MNIST images are 28 pixels in each dimension.
img_size = 28

# Images are stored in one-dimensional arrays of this length.
img_size_flat = img_size * img_size

# Tuple with height and width of images used to reshape arrays.
img_shape = (img_size, img_size)

# Number of classes, one class for each of 10 digits.
num_classes = 10
Helper-function for plotting images
this is a helper-function for plotting images, and it creates a figure with 3 by 3 sub-plots and then it goes through those sub-plots and shows the images note that the images are stored as one-dimensional weight vectors so we have to reshape them into a 28 by 28 pixel image
In [8]:
def plot_images(images, cls_true, cls_pred=None):
    assert len(images) == len(cls_true) == 9

    # Create figure with 3x3 sub-plots.
    fig, axes = plt.subplots(3, 3)
    fig.subplots_adjust(hspace=0.3, wspace=0.3)

    for i, ax in enumerate(axes.flat):
        # Plot image.
        ax.imshow(images[i].reshape(img_shape), cmap='binary')

        # Show true and predicted classes.
        if cls_pred is None:
            xlabel = "True: {0}".format(cls_true[i])
        else:
            xlabel = "True: {0}, Pred: {1}".format(cls_true[i], cls_pred[i])

        ax.set_xlabel(xlabel)

        # Remove ticks from the plot.
        ax.set_xticks([])
        ax.set_yticks([])

    # Ensure the plot is shown correctly with multiple plots
    # in a single Notebook cell.
    plt.show()
Plot a few images to see if data is correct
let's plot a few images from the test-set to see if the data is correct.
In [9]:
# Get the first images from the test-set.
images = data.test.images[0:9]

# Get the true classes for those images.
cls_true = data.test.cls[0:9]

# Plot the images and labels using our helper-function above.
plot_images(images=images, cls_true=cls_true)
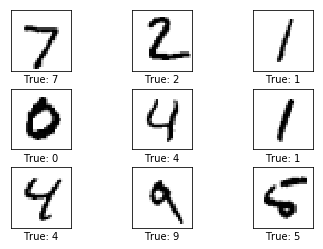
So we plot the first nine images and we have here the true classes for each of those images so the first image is 7, and the true class is indeed a 7 and the second one is 2, 3rd is 1 and so on, and then we have one that looks a bit strange it, the true class for this image is 5 but this image actually gives problems as we will see below
TensorFlow Graph
The entire purpose of TensorFlow is to have a so-called computational graph that can be executed much more efficiently than if the same calculations were to be performed directly in Python. TensorFlow can be more efficient than NumPy because TensorFlow knows the entire computation graph that must be executed, while NumPy only knows the computation of a single mathematical operation at a time.
TensorFlow can also automatically calculate the gradients that are needed to optimize the variables of the graph so as to make the model perform better. This is because the graph is a combination of simple mathematical expressions so the gradient of the entire graph can be calculated using the chain-rule for derivatives.
TensorFlow can also take advantage of multi-core CPUs as well as GPUs - and Google has even built special chips just for TensorFlow which are called TPUs (Tensor Processing Units) and are even faster than GPUs.
A TensorFlow graph consists of the following parts which will be detailed below:
- Placeholder variables used to change the input to the graph.
- Model variables that are going to be optimized so as to make the model perform better.
- The model which is essentially just a mathematical function that calculates some output given the input in the placeholder variables and the model variables.
- A cost measure that can be used to guide the optimization of the variables.
- An optimization method which updates the variables of the model.
you can also use something called TensorBoard for debugging and logging data but we don't use that in this tutorial
Placeholder variables
so the placeholder variables are the things in the computational graph that we can replace with actual input and the way that we defined the placeholder variable for our input images is like this
In [10]:
x = tf.placeholder(tf.float32, [None, img_size_flat])
x = tf.placeholder and the data type is floating point 32-bit and this placeholder variable is a two-dimensional tensor that is a two-dimensional array or a two-dimensional matrix and we set the number of rows in this matrix to None which means that it can have an arbitrary number of rows, and the number of columns and the matrix is set to img_size_flat because we want x to hold for each row we want it to hold an image which is a flattened vector of this size img_size_flat
In [11]:
y_true = tf.placeholder(tf.float32, [None, num_classes])
for each image in x we have a label which is the one-hot encoded class for that image and we call this the true class y_true and again we have a floating point placeholder variable and now we have a matrix with an arbitrary number of rows but the number of columns is equal to the number of classes which is ten, one for each digit zero to nine
In [12]:
y_true_cls = tf.placeholder(tf.int64, [None])
sometimes we also need the class as a number as a single number instead of being one-hot encoded so we have that in y_true_cls and it's a placeholder variable and this time it's an integer and it can be an arbitrary length so it's just a one-dimensional tensor or array whose length is set to None
Variables to be optimized
so now we have to find the placeholder variables and now we need the models variables that are going to be optimized and these are traditionally called weights and biases
In [13]:
weights = tf.Variable(tf.zeros([img_size_flat, num_classes]))
So we define the weights as a tf.Variable and we initialize it to zeros and we will see in a moment that when we matrix multiply this with x we get the output shape that we want.
In [14]:
biases = tf.Variable(tf.zeros([num_classes]))
so we also define the biases and that's another variable and it's just a one-dimensional tensor or vector of length 10 for the num_classes and this is also initialized to zeros
it's important to mention that nothing is actually initialized or calculated at this point in time we are just building the computational graph then later we will start executing it
Model
This simple mathematical model just multiplies the images in the placeholder variable x with the weights and then it adds the biases.
so the result is a matrix of shape num_images rows and num_clauses columns
and we will give this result the name logits because that is typical intensive loan
In [15]:
logits = tf.matmul(x, weights) + biases
so again nothing has been computed yet but the idea is that logits will now when we start computing this it will hold a matrix which has num_images rows & num_classes columns
and the element of the i 'th row and j 'th column is an estimate of how likely the i 'th input image is to be of the j 'th class
and this may be a little tricky to understand
however these estimates are quite rough and there might be very small numbers of very large numbers and what we would like is that we will like each estimate to be a number between 0 and 1 and when we sum the estimate for each class of each image we want them to sum to 1 so that we can sort of interpret them as probabilities
In [16]:
y_pred = tf.nn.softmax(logits)
so we have now calculated y_pred which is for each image it gives us an effector of length 10 and sometimes we like to have this class as a number as an integer
so we use tensorflow to calculate the argmax which gives us for each vector it gives us the index of the element that is highest
In [17]:
y_pred_cls = tf.argmax(y_pred, axis=1)
Cost-function to be optimized
So in order to optimize the weights and balances we need to define the cost measure and we use the cross_entropy because it gives us a continuous performance measure and the minimum is 0
so if it's a perfect match in the classification then the result is a 0 and otherwise it's some positive number
In [18]:
cross_entropy = tf.nn.softmax_cross_entropy_with_logits(logits=logits,
                                                        labels=y_true)
so what we do is that for each input image we calculate the cross_entropy between predicted classes and the true classes and there is a little catch to this because we have to use logits because if we use y_pred it has already calculated the softmax and then it gives us the wrong results, so we need to use the logits and y_true
In [19]:
cost = tf.reduce_mean(cross_entropy)
this calculates the cross_entropy for their classification of each input image and we need the cost measure to be a single scalar value so we just calculate the average of all these cross_entropy for all the images
Optimization method
Now we can define the optimization method and we just use the built-in gradient descent which is the most basic optimizer in tensorflow, and we tell it that it should minimize the cost that we previous calculated, so the average of the cross_entropy of all the input images.
In [20]:
optimizer = tf.train.GradientDescentOptimizer(learning_rate=0.5).minimize(cost)
however again you should note that nothing is calculated here we're just building the computational graph
Performance measures
In addition to this we sometimes need to measure the performance of how our classification is doing
In [21]:
correct_prediction = tf.equal(y_pred_cls, y_true_cls)
so we first calculate for each input image what it was classified correctly so we compare the predicted classification with the true classification
In [22]:
accuracy = tf.reduce_mean(tf.cast(correct_prediction, tf.float32))
And then we calculate the classification accuracy which is just the the number of correctly classified images divided by the total number of input images and the way we do that is that we cast this boolean array to floating-point so that the false becomes 0 and the true becomes 1 then we just calculate the mean it's just a little computational trick
TensorFlow Run
So now we are finally ready to run our computational graph nothing has been computed yet and now we want to do that
Create TensorFlow session
First we have to create a tensorflow session we do this with this command here
In [23]:
session = tf.Session()
Initialize variables
and now we want to initialize all the variables so those are the weights and the biases and we do that by running the session with this function here tf.initialize_all_variables()
In [24]:
session.run(tf.global_variables_initializer())
Helper-function to perform optimization iterations
Remember that there are 50,000 images in the training-set and it takes a long time if we were to calculate the gradient of the model using all these images so we therefore use a batch_size of 100
In [25]:
batch_size = 100
This is also sometimes called a mini batch size so that in each iteration of the optimizer we just calculate the gradient for 100 images in the training-set
In [26]:
def optimize(num_iterations):
    for i in range(num_iterations):
        # Get a batch of training examples.
        # x_batch now holds a batch of images and
        # y_true_batch are the true labels for those images.
        x_batch, y_true_batch = data.train.next_batch(batch_size)

        # Put the batch into a dict with the proper names
        # for placeholder variables in the TensorFlow graph.
        # Note that the placeholder for y_true_cls is not set
        # because it is not used during training.
        feed_dict_train = {x: x_batch,
                           y_true: y_true_batch}

        # Run the optimizer using this batch of training data.
        # TensorFlow assigns the variables in feed_dict_train
        # to the placeholder variables and then runs the optimizer.
        session.run(optimizer, feed_dict=feed_dict_train)
So the helper function for doing this looks like this it takes number of iterations and then it has followed and we use a tensorflow function to get the next random batch of training images so expansional holds 100 randomly selected images from the training-set and
y_true batch holds true classification labels for those images
then we have to create what is called a feed_dict or a feed dictionary, and the keys in this dictionary have to match the placeholder variables that we defined above, so x is a placeholder variable for the matrix of images and y_true is a placeholder variable for the matrix of true classification labels for those images
And then we define the feed_dick and then we say run the tensorflow session with the optimizer and remember that we define this above to be gradient descent and we feed in the data that we just set which is the training batch
And it calculates the predicted class for all the images and the cross_entropy and it takes average it to calculate the cost and then tensorflow does something quite magical and it goes back through this computational graph and calculates the gradients for our weights and biases and this happens all behind the scenes, and then uses the GradientDescentOptimizer to update the weights and biases
Helper-functions to show performance
ok before we can show the results first need a few helper-function so we need another feed dict for the test-set
In [27]:
feed_dict_test = {x: data.test.images,
                  y_true: data.test.labels,
                  y_true_cls: data.test.cls}
so we set the images and the true classification labels and the classification integers to be those from the test-set
In [28]:
def print_accuracy():
    # Use TensorFlow to compute the accuracy.
    acc = session.run(accuracy, feed_dict=feed_dict_test)

    # Print the accuracy.
    print("Accuracy on test-set: {0:.1%}".format(acc))
the function here prints the classification accuracy on the test-set so we just use the feed_dict that we just created and then we run the tensorflow session with a part of the computational graph that calculates the classification accuracy
remember that would be we define this before we can also print the so called confusion matrix which gives us more details about the classification errors, and we use scikit-learn for this
In [29]:
def print_confusion_matrix():
    # Get the true classifications for the test-set.
    cls_true = data.test.cls

    # Get the predicted classifications for the test-set.
    cls_pred = session.run(y_pred_cls, feed_dict=feed_dict_test)

    # Get the confusion matrix using sklearn.
    cm = confusion_matrix(y_true=cls_true,
                          y_pred=cls_pred)

    # Print the confusion matrix as text.
    print(cm)

    # Plot the confusion matrix as an image.
    plt.imshow(cm, interpolation='nearest', cmap=plt.cm.Blues)

    # Make various adjustments to the plot.
    plt.tight_layout()
    plt.colorbar()
    tick_marks = np.arange(num_classes)
    plt.xticks(tick_marks, range(num_classes))
    plt.yticks(tick_marks, range(num_classes))
    plt.xlabel('Predicted')
    plt.ylabel('True')

    # Ensure the plot is shown correctly with multiple plots
    # in a single Notebook cell.
    plt.show()
And this is a helper-function which takes some of the mis-classified images and plots them
In [30]:
def plot_example_errors():
    # Use TensorFlow to get a list of boolean values
    # whether each test-image has been correctly classified,
    # and a list for the predicted class of each image.
    correct, cls_pred = session.run([correct_prediction, y_pred_cls],
                                    feed_dict=feed_dict_test)

    # Negate the boolean array.
    incorrect = (correct == False)

    # Get the images from the test-set that have been
    # incorrectly classified.
    images = data.test.images[incorrect]

    # Get the predicted classes for those images.
    cls_pred = cls_pred[incorrect]

    # Get the true classes for those images.
    cls_true = data.test.cls[incorrect]

    # Plot the first 9 images.
    plot_images(images=images[0:9],
                cls_true=cls_true[0:9],
                cls_pred=cls_pred[0:9])
Helper-function to plot the model weights
It is also helpful to plot the weights of the model and that is done in this helper-function
In [31]:
def plot_weights():
    # Get the values for the weights from the TensorFlow variable.
    w = session.run(weights)

    # Get the lowest and highest values for the weights.
    # This is used to correct the colour intensity across
    # the images so they can be compared with each other.
    w_min = np.min(w)
    w_max = np.max(w)

    # Create figure with 3x4 sub-plots,
    # where the last 2 sub-plots are unused.
    fig, axes = plt.subplots(3, 4)
    fig.subplots_adjust(hspace=0.3, wspace=0.3)

    for i, ax in enumerate(axes.flat):
        # Only use the weights for the first 10 sub-plots.
        if i<10:
            # Get the weights for the i'th digit and reshape it.
            # Note that w.shape == (img_size_flat, 10)
            image = w[:, i].reshape(img_shape)

            # Set the label for the sub-plot.
            ax.set_xlabel("Weights: {0}".format(i))

            # Plot the image.
            ax.imshow(image, vmin=w_min, vmax=w_max, cmap='seismic')

        # Remove ticks from each sub-plot.
        ax.set_xticks([])
        ax.set_yticks([])

    # Ensure the plot is shown correctly with multiple plots
    # in a single Notebook cell.
    plt.show()
Performance before any optimization
So before we start optimizing the model let's print the classification accuracy on the test-set and it shows it is 9.8%
In [32]:
print_accuracy()
Accuracy on test-set: 9.8%
In [33]:
plot_example_errors()
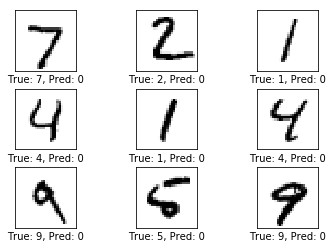
And what happens here is that the model always outputs zero so the model always predicts that the image is a zero and it just happens at 9.8% of the images in the test set are zeros
Performance after 1 optimization iteration
So let's perform a single optimization iteration then the classification accuracy is 21.4%, so that is actually quite a lot just from a single optimization iteration
In [34]:
optimize(num_iterations=1)
In [35]:
print_accuracy()
Accuracy on test-set: 21.4%
In [36]:
plot_example_errors()
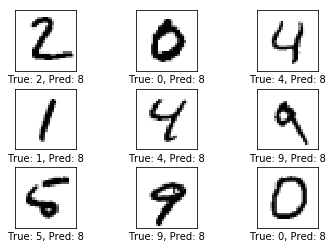
so let's see a few examples of where the model miss-classifiers the images, and in this first example the image shows a 2 and the model has predicted that it's a 8 and then the second one it shows a 0 but the model predicted it was a 8, and so on
so the model is is still quite bad but it only had one optimization iteration
so let's show the weight of the model
In [37]:
plot_weights()
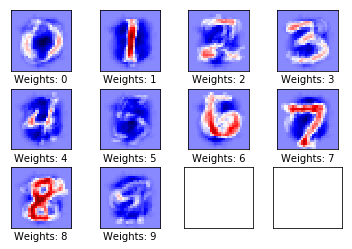
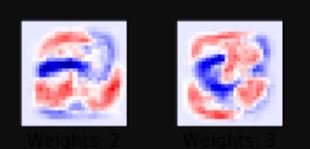
The weights that are used to determine if the input image is as 0, the positive weights are red and the negative weights are blue, and we can interpret these weights as being filters on the image so if we overlay an input image on this filter then pixels inside this search in this circle here have a positive reaction on whether this might be a 0 or something else, and if there are pixels inside the center of the circle then it has a negative reaction so this filter like seeing circles with nothing inside
The weights that are used to determine if the input image is a 1 have positive weights as a vertical line in the center and has negative weights around that so if we input an image here that has black pixels and then centre a vertical line and nothing around it then this filter here will have a positive reaction to the input image
Now the weights that are used to determine if the input image is a 2 are more difficult to interpret we have some slightly positive weights up and down and then we have very negative weights, so we can sort of image in that this might be a 2 but it has actually not recognized 2 it has rocognized something like the inversion of two.
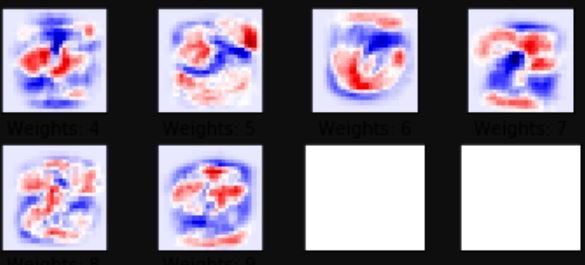
The weights for 3, 4, and some what 5, 6, 7, 8, and 9 those most of these are quite clear what the weights try to recognize in the input image.
Performance after 10 optimization iterations
So now let's try and perform some more optimization iterations.
In [38]:
# We have already performed 1 iteration.
optimize(num_iterations=9)
In [39]:
print_accuracy()
Accuracy on test-set: 79.3%
We have already performed one above and we perform an additional line so that we have a total of ten iterations, and now the classification accuracy is 79.3%
In [40]:
plot_example_errors()
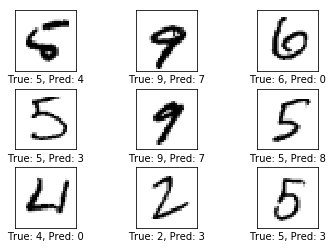
and if we look at some of the classification errors and the model now thinks that a 4 but in reality it's a 5 and second one the model says is a 7 but it's a 9 and so on
In [41]:
plot_weights()
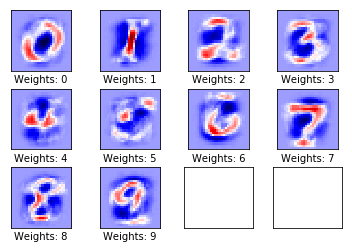
let's look at the weights again for the model so now they actually all of them quite clear what they're trying to recognize 0,1,2,3,4,5,6,7,8,9
Performance after 1000 optimization iterations
But let's see what happens when we perform a thousand optimization iterations
In [42]:
# We have already performed 10 iterations.
optimize(num_iterations=990)
In [43]:
print_accuracy()
Accuracy on test-set: 91.8%
so now the accuracy and the test-set is 91.8% so this means that in 8.2% are almost one out of ten cases we miss classify an image in the test-set
In [44]:
plot_example_errors()
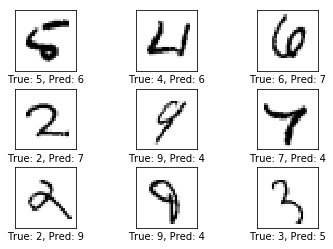
so let's look at some of the examples and and here the true class for the image is a 5 but the model predicts that it's a 6 and that is sort of understandable because this is a very badly drawn 5 it could be a 6 so that's fair
and the next one the true class is a 4 this is supposed to be a 4 but the model predicted that it's a 6 okay that's a bit strange
the next one the true class is a 6 the model predicted that is a 7 I don't that's not very good actually it should be able to predict that this was a 6
and the next down we have 2 and the model predicted that it was a 7 and before that we have a 6 where predicted that it was a 7
so the model is not very good actually it's really should be able to do this and what you can try is that you can try in the exercises, you can try and execute 1000 optimization iterations and see if it gets better.
In [45]:
plot_weights()
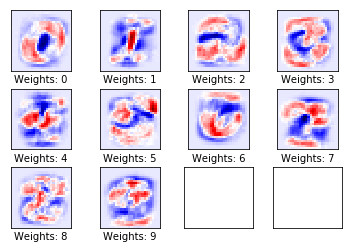
so let's look at the model weights after having been optimized for 1000 iterations and remember that in each iteration we selected randomly a hundred images from the training-set and calculated the gradient and updated the weights and biases using these gradients for the classification errors
So now the weights that I used to classify a 0, the strongest weights are now in the centre, so that if we see black pixels in the center of the image then it has a very negative effect on whether the model thinks that this is a 0 or not, and then we have sort of a circle surrounding that center and those are red so if we see black pixels in the input image that are sort of a circle then that has a positive effect on estimating that this is probably a 0
and the weights for classifying whether the input image is a 1 still has the vertical line which are strong positive weights and then we have some strong negative weight surrounding that
so that is also still somewhat clear what these weights try to recognize in the input image
but for the other classes this is not clear at all so this is maybe with a bit of imagination we could say this tries to recognize 2 and maybe we could say this trying to recognize 3
But how about this
what is going on here it looks like the model has sort of tried to make a compromise of all the images that it has seen in the training-set and say oh if we see pixels then this must be a 4, and of course this is not at all how a human recognizes a 4
And similarly for the 5 it says if we see black pixels the input image where the weights are a blue then we classify it as a 5 so I don't know it's weird and you can sort of maybe if you have a lot of imagination and maybe if you smoke some weed or something maybe you can see an 8 or a 9, but I have to say it gives the impression that the model actually doesn't really understand what is going on it doesn't really understand how to recognize digits so for this we need a more sophisticated model
now we can also print the confusion matrix and this is actually quite confusing to look at
In [46]:
print_confusion_matrix()
[[ 952    0    0    1    0   10   13    2    2    0]
 [   0 1109    2    2    1    2    4    2   13    0]
 [   6   11  889   16   16    7   17   18   46    6]
 [   3    1   14  901    1   36    5   15   19   15]
 [   1    1    2    1  918    0   16    2    9   32]
 [   8    3    1   27    7  784   20    8   26    8]
 [   7    3    2    2    9   12  920    2    1    0]
 [   2   10   19    8    6    1    0  952    2   28]
 [   5    6    4   17    9   37   13   13  859   11]
 [  10    6    1    9   42    8    1   31    7  894]]
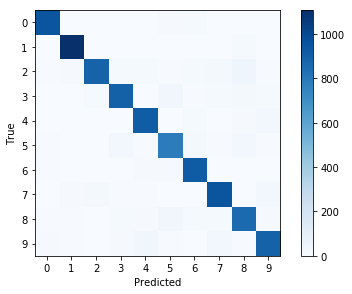
it may be a little simpler to look at the plot instead, so what this shows us that for example for the true class 5 it is sometimes mis-classified as a 3 and sometimes as an 8, and I suppose that makes sense because a 3 block sort of like a 5 which would look sort of like an 8
So after we are done using tensorflow we really should close the session
In [47]:
session.close()
And I hope you understand better how tensorflow works if you do it yourself.
Posted on Utopian.io - Rewarding Open Source Contributors
Thanks for the contribution.
Need help? Write a ticket on https://support.utopian.io.
Chat with us on Discord.
[utopian-moderator]
Downvoting a post can decrease pending rewards and make it less visible. Common reasons:
Submit
Your contribution is marked as plagiarism.
Plagiarism is not accepted on Utopian and may lead to bans.
Original can be found here
Need help? Write a ticket on https://support.utopian.io.
Chat with us on Discord.
[utopian-moderator]
Downvoting a post can decrease pending rewards and make it less visible. Common reasons:
Submit