What Will I Learn?
- How to implement a simple Convolutional Neural Network in TensorFlow
- How to Configuration of Neural Network in TensorFlow
- How to load data
- Data Dimesion of TensorFlow
- TensorFlow Graph
- How to run TensorFlow
Requirements
- Python3
- Jupyter Notebook
- TensorFlow package
- Intermediate Python3
Difficulty
- Intermediate
Curriculum
Tutorial Contents
The previous tutorial showed that a simple linear model had about 91% classification accuracy for recognizing hand-written digits in the MNIST data-set.
In this tutorial we will implement a simple Convolutional Neural Network in TensorFlow which has a classification accuracy of about 99%, or more if you make some of the suggested exercises.
Convolutional Networks work by moving small filters across the input image. This means the filters are re-used for recognizing patterns throughout the entire input image. This makes the Convolutional Networks much more powerful than Fully-Connected networks with the same number of variables. This in turn makes the Convolutional Networks faster to train.
You should be familiar with basic linear algebra, Python and the Jupyter Notebook editor. Beginners to TensorFlow may also want to study the first tutorial before proceeding to this one.
Imports
Here we import all the relevant packages.
In [1]:
%matplotlib inline
import matplotlib.pyplot as plt
import tensorflow as tf
import numpy as np
from sklearn.metrics import confusion_matrix
import time
from datetime import timedelta
import math
and this particular source code was developed with tensorflow version ‘1.4.0’
In [2]:
tf.__version__
Out [2]:
'1.4.0'
Configuration of Neural Network
Here we define the configuration of the neural network
In [3]:
# Convolutional Layer 1.
filter_size1 = 5          # Convolution filters are 5 x 5 pixels.
num_filters1 = 16         # There are 16 of these filters.

# Convolutional Layer 2.
filter_size2 = 5          # Convolution filters are 5 x 5 pixels.
num_filters2 = 36         # There are 36 of these filters.

# Fully-connected layer.
fc_size = 128             # Number of neurons in fully-connected layer.
The first convolutional layer where we have a filter_size of 5 by 5 pixels and we have 16 filters, and then the second convolutional layer we also have 5 by 5 pixel filters and we have 36 filters, in the fully connected layer we have 128 nodes
Load Data
Here we load the data, and this is the MNIST data-set and you can change this path if you have already downloaded it, otherwise it is 12 megabyte to download.
In [4]:
from tensorflow.examples.tutorials.mnist import input_data
data = input_data.read_data_sets('data/MNIST/', one_hot=True)
Out [4]:
Extracting data/MNIST/train-images-idx3-ubyte.gz
Extracting data/MNIST/train-labels-idx1-ubyte.gz
Extracting data/MNIST/t10k-images-idx3-ubyte.gz
Extracting data/MNIST/t10k-labels-idx1-ubyte.gz
In [5]:
print("Size of:")
print("- Training-set:\t\t{}".format(len(data.train.labels)))
print("- Test-set:\t\t{}".format(len(data.test.labels)))
print("- Validation-set:\t{}".format(len(data.validation.labels)))
Out [5]:
Size of:
- Training-set: 55000
- Test-set:     10000
- Validation-set:   5000
and we see there is a total of 70000 images in the data-set and it is split in a training-set with 55000, a test-set with 10000 and a validation-set with 5000, and we don't use the validation-set here
In [6]:
data.test.cls = np.argmax(data.test.labels, axis=1)
The class-labels are One-Hot encoded but we also want the class of each image as a number I have explained this better in the first tutorial .
Data Dimensions
Here we have the dimensions for our data and the image size is 28 by 28 pixels and the input number of input channels is 1 because it's grayscale, and we have 10 classes so this is one for each of the digits 0, 1, 2, and so on up to 9
In [7]:
# We know that MNIST images are 28 pixels in each dimension.
img_size = 28

# Images are stored in one-dimensional arrays of this length.
img_size_flat = img_size * img_size

# Tuple with height and width of images used to reshape arrays.
img_shape = (img_size, img_size)

# Number of colour channels for the images: 1 channel for gray-scale.
num_channels = 1

# Number of classes, one class for each of 10 digits.
num_classes = 10
Helper-function for plotting images
Here we have a helper-function for plotting the images
In [8]:
def plot_images(images, cls_true, cls_pred=None):
    assert len(images) == len(cls_true) == 9

    # Create figure with 3x3 sub-plots.
    fig, axes = plt.subplots(3, 3)
    fig.subplots_adjust(hspace=0.3, wspace=0.3)

    for i, ax in enumerate(axes.flat):
        # Plot image.
        ax.imshow(images[i].reshape(img_shape), cmap='binary')

        # Show true and predicted classes.
        if cls_pred is None:
            xlabel = "True: {0}".format(cls_true[i])
        else:
            xlabel = "True: {0}, Pred: {1}".format(cls_true[i], cls_pred[i])

        # Show the classes as the label on the x-axis.
        ax.set_xlabel(xlabel)

        # Remove ticks from the plot.
        ax.set_xticks([])
        ax.set_yticks([])

    # Ensure the plot is shown correctly with multiple plots
    # in a single Notebook cell.
    plt.show()
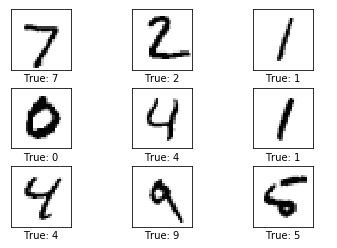
Plot a few images to see if data is correct
We get some of the images from the test-set and the true classes and we plot them.
In [9]:
# Get the first images from the test-set.
images = data.test.images[0:9]

# Get the true classes for those images.
cls_true = data.test.cls[0:9]

# Plot the images and labels using our helper-function above.
plot_images(images=images, cls_true=cls_true)
TensorFlow Graph
The entire purpose of TensorFlow is to have a so-called computational graph that can be executed much more efficiently than if the same calculations were to be performed directly in Python. TensorFlow can be more efficient than NumPy because TensorFlow knows the entire computation graph that must be executed, while NumPy only knows the computation of a single mathematical operation at a time.
TensorFlow can also automatically calculate the gradients that are needed to optimize the variables of the graph so as to make the model perform better. This is because the graph is a combination of simple mathematical expressions so the gradient of the entire graph can be calculated using the chain-rule for derivatives.
TensorFlow can also take advantage of multi-core CPUs as well as GPUs - and Google has even built special chips just for TensorFlow which are called TPUs (Tensor Processing Units) and are even faster than GPUs.
A TensorFlow graph consists of the following parts which will be detailed below:
- Placeholder variables used for inputting data to the graph.
- Variables that are going to be optimized so as to make the convolutional network perform better.
- The mathematical formulas for the convolutional network.
- A cost measure that can be used to guide the optimization of the variables.
- An optimization method which updates the variables.
In addition, the TensorFlow graph may also contain various debugging statements e.g. for logging data to be displayed using TensorBoard, which is not covered in this tutorial.
Helper-functions for creating new variables
Let's make a few helper-functions for creating new variables, first we have a function for creating new weights and this takes in a shape and it creates random weights
In [10]:
def new_weights(shape):
    return tf.Variable(tf.truncated_normal(shape, stddev=0.05))
In [11]:
def new_biases(length):
    return tf.Variable(tf.constant(0.05, shape=[length]))
And then we have another one for creating biases and this just create a vector of random biases values
But it's important to realize that nothing is actually calculated here, we're just creating objects in tensorflow for adding to the graph which can be calculated later.
Helper-function for creating a new Convolutional Layer
Now we have a helper-function for creating a new convolutional layer, as you saw before the function for doing this in tensorflow is quite complicated so we prefer to wrap the tensorflow implementation in another function which makes it simpler for us to add new convolutional layers to our network.
We assume that the input to a convolutional layer is a four-dimensional tensor or dimensional array or matrix with the following dimensions:
- Image number.
Y-axisof each image.X-axisof each image.- Channels of each image.
The output is also a four-dimensional tensor the following dimensions:
- Image number, same as input
X-axisof each numberY-axisof each image- Channels for each of the convolutional filters that we have in this layer
So the helper function looks like this
In [12]:
def new_conv_layer(input,              # The previous layer.
                   num_input_channels, # Num. channels in prev. layer.
                   filter_size,        # Width and height of each filter.
                   num_filters,        # Number of filters.
                   use_pooling=True):  # Use 2x2 max-pooling.

    # Shape of the filter-weights for the convolution.
    # This format is determined by the TensorFlow API.
    shape = [filter_size, filter_size, num_input_channels, num_filters]

    # Create new weights aka. filters with the given shape.
    weights = new_weights(shape=shape)

    # Create new biases, one for each filter.
    biases = new_biases(length=num_filters)

    # Create the TensorFlow operation for convolution.
    # Note the strides are set to 1 in all dimensions.
    # The first and last stride must always be 1,
    # because the first is for the image-number and
    # the last is for the input-channel.
    # But e.g. strides=[1, 2, 2, 1] would mean that the filter
    # is moved 2 pixels across the x- and y-axis of the image.
    # The padding is set to 'SAME' which means the input image
    # is padded with zeroes so the size of the output is the same.
    layer = tf.nn.conv2d(input=input,
                         filter=weights,
                         strides=[1, 1, 1, 1],
                         padding='SAME')

    # Add the biases to the results of the convolution.
    # A bias-value is added to each filter-channel.
    layer += biases

    # Use pooling to down-sample the image resolution?
    if use_pooling:
        # This is 2x2 max-pooling, which means that we
        # consider 2x2 windows and select the largest value
        # in each window. Then we move 2 pixels to the next window.
        layer = tf.nn.max_pool(value=layer,
                               ksize=[1, 2, 2, 1],
                               strides=[1, 2, 2, 1],
                               padding='SAME')

    # Rectified Linear Unit (ReLU).
    # It calculates max(x, 0) for each input pixel x.
    # This adds some non-linearity to the formula and allows us
    # to learn more complicated functions.
    layer = tf.nn.relu(layer)

    # Note that ReLU is normally executed before the pooling,
    # but since relu(max_pool(x)) == max_pool(relu(x)) we can
    # save 75% of the relu-operations by max-pooling first.

    # We return both the resulting layer and the filter-weights
    # because we will plot the weights later.
    return layer, weights
It takes the input which is a previous layer, and then the number of input channels so that is the number of channels that were output in the previous layer, and then we have the filter_size which is for example 5 by 5 pixels but this would be a number 5 and then we have in the num_filters and for the first layer in this configuration we add 16 and then the second layer we will have 36
use_pooling=True: we have a boolean whether we wish to use 2x2 max-pooling to downsample the image after we have applied the filter
First we have to allocate the weights or the filters that we are going to apply and these are the variables that are going to be optimized so that we can better classify the input images
shape: A four dimensional tensor which has theshapewhich is determined by the tensorflow API, thefilter_sizeon thex_axisand they_axiswe set it to the same because it's a lot simplerweights: then we create new randomweightsand again nothing is calculated with just making computational node for the tensorflow graphbiases: and we want to add biases values to each of these filters so we create a vector in the correct length
Now we have the weights we can create the tensorflow operation for doing the actual convolution, so we give it the input which is the output from the previous layer and we give the weights that we have just allocated and we give it what is called a strides this is four times one and it means that it moves 1 in the first dimension in the second and third and the fourth dimension, the first 1 was for the image number, the second 1 was for the x-axis, and then the y-axis, and then the input channel
And we cannot change the first one and the last one they always have to be one because it's the image number and the input channel, but the two in the middle we can change them, so this is how many pixels that we are moving the filter across the input image
All right so now we have created the convolution we add a biases value layer += biases to the output of each filter
And we have actually not calculated anything here, we have just built a part of the computational graph so we return it along with the weights so we can plot them later.
Helper-function for flattening a layer
Remember that the output of a convolutional layer is four-dimensional and in order to use a fully-connected layer we need a two-dimensional input to that layer so we have to flattening the four-dimensional tensor into a two-dimensional tensor and we do that in this function below.
In [13]:
def flatten_layer(layer):
    # Get the shape of the input layer.
    layer_shape = layer.get_shape()

    # The shape of the input layer is assumed to be:
    # layer_shape == [num_images, img_height, img_width, num_channels]

    # The number of features is: img_height * img_width * num_channels
    # We can use a function from TensorFlow to calculate this.
    num_features = layer_shape[1:4].num_elements()

    # Reshape the layer to [num_images, num_features].
    # Note that we just set the size of the second dimension
    # to num_features and the size of the first dimension to -1
    # which means the size in that dimension is calculated
    # so the total size of the tensor is unchanged from the reshaping.
    layer_flat = tf.reshape(layer, [-1, num_features])

    # The shape of the flattened layer is now:
    # [num_images, img_height * img_width * num_channels]

    # Return both the flattened layer and the number of features.
    return layer_flat, num_features
Helper-function for creating a new Fully-Connected Layer
We have the output of the previous layer as an input, then we have the num_inputs that is the number of outputs from the previous layer and then we have the num_outputs in the layer and whether we want to use the Rectified Linear Unit (ReLU) or not.
This creates another piece of the computational graph which we then return so we can continue building the graph
In [14]:
def new_fc_layer(input,          # The previous layer.
                 num_inputs,     # Num. inputs from prev. layer.
                 num_outputs,    # Num. outputs.
                 use_relu=True): # Use Rectified Linear Unit (ReLU)?

    # Create new weights and biases.
    weights = new_weights(shape=[num_inputs, num_outputs])
    biases = new_biases(length=num_outputs)

    # Calculate the layer as the matrix multiplication of
    # the input and weights, and then add the bias-values.
    layer = tf.matmul(input, weights) + biases

    # Use ReLU?
    if use_relu:
        layer = tf.nn.relu(layer)

    return layer
Placeholder variables
Now we move on to the placeholder variables which are used to change input to the computational graph
In [15]:
x = tf.placeholder(tf.float32, shape=[None, img_size_flat], name='x')
X is the input images and the shape is set to a None and image size flat and this means it has an arbitrary number of images each image and it’s a one-dimensional vector of this length
In [16]:
x_image = tf.reshape(x, [-1, img_size, img_size, num_channels])
However the convolutional layers expect x to be encoded as a four-dimensional tensor so we have to reshape it. The first dimension is the number of images and we have set this to -1 so it is calculated automatically by using the other numbers, and the second dimension is a width of the image and the third is the height of the image and then we have the number of channels
In [17]:
y_true = tf.placeholder(tf.float32, shape=[None, num_classes], name='y_true')
Then we have the placeholder variable for the true class label of each image and remember that these are one-hot encoded vectors of length 10 and again we set the first dimension of the shape to None which means it can be an arbitrary number of input images.
We could also have a placeholder variable for the class-number that is an integer for each class instead of the one-hot encoded vector but we will instead use argmax for various reasons and it is calculated like this
In [18]:
y_true_cls = tf.argmax(y_true, axis=1)
Convolutional Layer 1
Create the first convolutional layer and we do that by calling the helper function above new_conv_layer and the input is x_image as we defined above and the num_input_channels which is 1 because they are grayscale images, and then we have the filter_size that we defined for the first layer which we set to 5 and then we have the number of filters which we set to 16 and then we want to use 2 x 2 max pooling so we set that to True, and we assign the results of this function to two variables which is called layer_conv1 and weights_conv1
In [19]:
layer_conv1, weights_conv1 = \
    new_conv_layer(input=x_image,
                   num_input_channels=num_channels,
                   filter_size=filter_size1,
                   num_filters=num_filters1,
                   use_pooling=True)
So the layer_conv is the tensorflow object for calculating convolutional layer and the weights_conv1 are the Associated weights that we want to plot later on.
In [20]:
layer_conv1
Out [21]:
<tf.Tensor 'Relu:0' shape=(?, 14, 14, 16) dtype=float32>
We can check that the layer is indeed a tensorflow object, if we look at it we see tf.Tensor and the last one was a Rectified Linear Unit and the shape of the output was (?, 14, 14, 16) and the question mark is the same as none above it means that there is an arbitrary number of input images, and the data type is a 32-bit floating-point number.
Convolutional Layer 2
We can take the output of the first convolutional layer and input it to the second convolutional layer and we do it like this
In [21]:
layer_conv2, weights_conv2 = \
    new_conv_layer(input=layer_conv1,
                   num_input_channels=num_filters1,
                   filter_size=filter_size2,
                   num_filters=num_filters2,
                   use_pooling=True)
We have the number of input channels to the second layer is a number of output channels from the first layer which is the number of filters 1 and the filter size for the second layer we define that to be 5 above, and the number of filters we set to be 36 and we want to use 2 x 2 max pooling again so we set that to True, and again we assign the result to two variables layer_conv2 and weights_conv2
In [22]:
layer_conv2
Out [22]:
<tf.Tensor 'Relu_1:0' shape=(?, 7, 7, 36) dtype=float32>
layer_conv2 we can show it and we see it's at tf.tensor and it's a Rectified Linear Unit again and it has the shape=( ?, 7, 7, 36) so this is a number of input images which is arbitrary and we have now reduced the original 28 x 28 input images to first we help them once in the first layer to 14 x 14 and now to 7 x 7 and we have 36 output channels, one for each of the filters in the second convolutional layer and the data type is again 32-bit floating-point.
So now we have created two convolutional layers and we have chained them together and all of this is now a tensorflow computational graph, so let's continue building on it.
Flatten Layer
We want to add some fully-connected layers but we first have to flatten the output of the convolutional layer because it's a four-dimensional tensor and we need a two-dimensional tensor so we calculate the flatten_layer helper function that we defined above, and we get the flatten layout and also the num_features because it's handy to use.
In [23]:
layer_flat, num_features = flatten_layer(layer_conv2)
In [24]:
layer_flat
Out [24]:
<tf.Tensor 'Reshape_1:0' shape=(?, 1764) dtype=float32>
In [25]:
num_features
Out [25]:
1764
Now if we look at the layer_flat variable there's a tf.tensor and it's a reshape operation and the shape of the output is a (?, 1764) which is 7 x 7 x 36 which corresponds to the 4-dimensional tensor that was output from the second convolutional layer.
Fully-Connected Layer 1
So now we create a fully-connected layer and we take the input to be the flattened layer from before and the num_inputs was the num_features in that layer and the num_outputs of this fully connected layer is set to fc_size which we set to 128 and the configuration above and we also want to use a Rectified Linear Unit so we set that to True
In [26]:
layer_fc1 = new_fc_layer(input=layer_flat,
                         num_inputs=num_features,
                         num_outputs=fc_size,
                         use_relu=True)
In [27]:
layer_fc1
Out [27]:
<tf.Tensor 'Relu_2:0' shape=(?, 128) dtype=float32>
And we can see that the result is at tensorflow operation and again it's a rectified linear unit because that's the last thing we do a number of things in fully-connected layer and the last one of them is a rectified linear unit and the output shape is a (?, 128) so we have an arbitrary number of images and each of them results in a vector with 128 elements so this is what we wanted.
Fully-Connected Layer 2
And we then add the last fully-connected layer so we take the first fully-connected layer use it as input to the second one and we give it the appropriate num_inputs and the num_outputs is now the num_classes
In [28]:
layer_fc2 = new_fc_layer(input=layer_fc1,
                         num_inputs=fc_size,
                         num_outputs=num_classes,
                         use_relu=False)
In [29]:
layer_fc2
Out [29]:
<tf.Tensor 'add_3:0' shape=(?, 10) dtype=float32>
So this is 10 because we have 10 different classes in the data and you have to note that we don't use the rectified linear unit now and it's an exercise where you can try and use it and see what is the difference, and because we don't use a rectified linear unit the last mathematical operation in the fully-connected layer is addition where we add the biases values to the matrix multiplication and the result is a tensor of shape (?, 10) so this is what we wanted.
Predicted Class
Now we have a rough estimate of how the network classifies the input image into different 10 different classes, but those numbers maybe very large or they maybe very small so what we do is we squish them while squash them so that they are all between 0 & 1 and so that the all sum to 1
In [30]:
y_pred = tf.nn.softmax(layer_fc2)
And this is done using the softmax function and then we have the class-number is the index of the largest element of each vector that is output from this softmax function.
In [31]:
y_pred_cls = tf.argmax(y_pred, axis=1)
Cost-function to be optimized
Remember that all the variables of the convolutional network will initialize to random values so at first the network will just produce random guesses at what the classes for the input images might be.
And we want to somehow change the variables of the network so that it performs better at classifying the input images and to do this we use something called the cross-entropy which measures how accurate the classifications of the network are compared to the true classes of the images, so we adding this tensorflow function to the computational graph.
In [32]:
cross_entropy = tf.nn.softmax_cross_entropy_with_logits(logits=layer_fc2,
                                                                labels=y_true)
and above calculates the cross-entropy for each of the input images and what we really need is a single value
In [33]:
cost = tf.reduce_mean(cross_entropy)
Optimization Method
Now we have a cost measures that we can minimize using the so called AdamOptimizer which is an advanced form of gradient descent
In [34]:
optimizer = tf.train.AdamOptimizer(learning_rate=1e-4).minimize(cost)
Performance Measures
In order to show how the network performs at the classification we first calculate whether the prediction of the class was correct so we compare the predicted-class to the true-class for each of the images and this creates a boolean array where we have a true/false value for each input image and then we can cast this to floating points so that the false becomes 0 and the true becomes 1.
In [35]:
correct_prediction = tf.equal(y_pred_cls, y_true_cls)
and then we calculate the average to get the classification error accuracy.
In [36]:
accuracy = tf.reduce_mean(tf.cast(correct_prediction, tf.float32))
TensorFlow Run
Create TensorFlow session
We have now created the tensorflow graph and we know how to create a session so that we can execute the graph, and we do that in this line here
In [37]:
session = tf.Session()
Initialize variables
First we initialize all the variables of the graph
In [38]:
session.run(tf.global_variables_initializer())
Helper-function to perform optimization iterations
We create a helper-function to perform the optimization iterations and instead of feeding all 50,000 training images at once we only feed 64 images at each time.
In [39]:
train_batch_size = 64
but the function looks like the one below
In [40]:
# Counter for total number of iterations performed so far.
total_iterations = 0

def optimize(num_iterations):
    # Ensure we update the global variable rather than a local copy.
    global total_iterations

    # Start-time used for printing time-usage below.
    start_time = time.time()

    for i in range(total_iterations,
                   total_iterations + num_iterations):

        # Get a batch of training examples.
        # x_batch now holds a batch of images and
        # y_true_batch are the true labels for those images.
        x_batch, y_true_batch = data.train.next_batch(train_batch_size)

        # Put the batch into a dict with the proper names
        # for placeholder variables in the TensorFlow graph.
        feed_dict_train = {x: x_batch,
                           y_true: y_true_batch}

        # Run the optimizer using this batch of training data.
        # TensorFlow assigns the variables in feed_dict_train
        # to the placeholder variables and then runs the optimizer.
        session.run(optimizer, feed_dict=feed_dict_train)

        # Print status every 100 iterations.
        if i % 100 == 0:
            # Calculate the accuracy on the training-set.
            acc = session.run(accuracy, feed_dict=feed_dict_train)

            # Message for printing.
            msg = "Optimization Iteration: {0:>6}, Training Accuracy: {1:>6.1%}"

            # Print it.
            print(msg.format(i + 1, acc))

    # Update the total number of iterations performed.
    total_iterations += num_iterations

    # Ending time.
    end_time = time.time()

    # Difference between start and end-times.
    time_dif = end_time - start_time

    # Print the time-usage.
    print("Time usage: " + str(timedelta(seconds=int(round(time_dif)))))
We first take the next batch of training examples, and we have the images and the true labels, then we create what is called a feed_dict and we execute the optimizer node of the computational graph with this feed_dict, and then for every 100 iterations we print the progress, and we also want to show the time usage for each function call.
Helper-function to plot example errors
Then we have a helper function for plotting example errors so we select some of the images that were mis-classified and then print them.
In [41]:
def plot_example_errors(cls_pred, correct):
    # This function is called from print_test_accuracy() below.

    # cls_pred is an array of the predicted class-number for
    # all images in the test-set.

    # correct is a boolean array whether the predicted class
    # is equal to the true class for each image in the test-set.

    # Negate the boolean array.
    incorrect = (correct == False)

    # Get the images from the test-set that have been
    # incorrectly classified.
    images = data.test.images[incorrect]

    # Get the predicted classes for those images.
    cls_pred = cls_pred[incorrect]

    # Get the true classes for those images.
    cls_true = data.test.cls[incorrect]

    # Plot the first 9 images.
    plot_images(images=images[0:9],
                cls_true=cls_true[0:9],
                cls_pred=cls_pred[0:9])
I won't go into the details on how this works but you can read the source code which has detailed comments
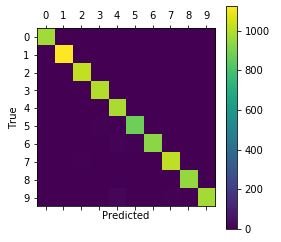
Helper-function to plot confusion matrix
Similarly we have a helper function for plotting the so-called confusion matrix and you can also read how that works in the source code.
In [42]:
def plot_confusion_matrix(cls_pred):
    # This is called from print_test_accuracy() below.

    # cls_pred is an array of the predicted class-number for
    # all images in the test-set.

    # Get the true classifications for the test-set.
    cls_true = data.test.cls

    # Get the confusion matrix using sklearn.
    cm = confusion_matrix(y_true=cls_true,
                          y_pred=cls_pred)

    # Print the confusion matrix as text.
    print(cm)

    # Plot the confusion matrix as an image.
    plt.matshow(cm)

    # Make various adjustments to the plot.
    plt.colorbar()
    tick_marks = np.arange(num_classes)
    plt.xticks(tick_marks, range(num_classes))
    plt.yticks(tick_marks, range(num_classes))
    plt.xlabel('Predicted')
    plt.ylabel('True')

    # Ensure the plot is shown correctly with multiple plots
    # in a single Notebook cell.
    plt.show()
Helper-function for showing the performance
Then we have a helper-function for tying all this together printing the classification accuracy on the test-set and calling one of the above helper-functions to plot classified images and so on.
In [43]:
# Split the test-set into smaller batches of this size.
test_batch_size = 256

def print_test_accuracy(show_example_errors=False,
                        show_confusion_matrix=False):

    # Number of images in the test-set.
    num_test = len(data.test.images)

    # Allocate an array for the predicted classes which
    # will be calculated in batches and filled into this array.
    cls_pred = np.zeros(shape=num_test, dtype=np.int)

    # Now calculate the predicted classes for the batches.
    # We will just iterate through all the batches.
    # There might be a more clever and Pythonic way of doing this.

    # The starting index for the next batch is denoted i.
    i = 0

    while i < num_test:
        # The ending index for the next batch is denoted j.
        j = min(i + test_batch_size, num_test)

        # Get the images from the test-set between index i and j.
        images = data.test.images[i:j, :]

        # Get the associated labels.
        labels = data.test.labels[i:j, :]

        # Create a feed-dict with these images and labels.
        feed_dict = {x: images,
                     y_true: labels}

        # Calculate the predicted class using TensorFlow.
        cls_pred[i:j] = session.run(y_pred_cls, feed_dict=feed_dict)

        # Set the start-index for the next batch to the
        # end-index of the current batch.
        i = j

    # Convenience variable for the true class-numbers of the test-set.
    cls_true = data.test.cls

    # Create a boolean array whether each image is correctly classified.
    correct = (cls_true == cls_pred)

    # Calculate the number of correctly classified images.
    # When summing a boolean array, False means 0 and True means 1.
    correct_sum = correct.sum()

    # Classification accuracy is the number of correctly classified
    # images divided by the total number of images in the test-set.
    acc = float(correct_sum) / num_test

    # Print the accuracy.
    msg = "Accuracy on Test-Set: {0:.1%} ({1} / {2})"
    print(msg.format(acc, correct_sum, num_test))

    # Plot some examples of mis-classifications, if desired.
    if show_example_errors:
        print("Example errors:")
        plot_example_errors(cls_pred=cls_pred, correct=correct)

    # Plot the confusion matrix, if desired.
    if show_confusion_matrix:
        print("Confusion Matrix:")
        plot_confusion_matrix(cls_pred=cls_pred)
The code above may use a lot of RAM so if it crashes you may have to lower the test_batch_size to something like maybe 50 and run it again.
Performance before any optimization
So let's print the classification accuracy before we do any optimization at all.
In [44]:
print_test_accuracy()
Out [44]:
Accuracy on Test-Set: 10.4% (1036 / 10000)
And in this case it is 10.4% so it means that we have classified correctly at about (1036 / 10000)`` images in thetest-set```.
Performance after 1 optimization iteration
In [45]:
optimize(num_iterations=1)
Out [45]:
Optimization Iteration:      1, Training Accuracy:  10.9%
Time usage: 0:00:00
In [46]:
print_test_accuracy()
Out [46]:
Accuracy on Test-Set: 10.9% (1090 / 10000)
Then let's perform one single up to my second iteration and recalculate the classification accuracy and now it is 10.9% so it has gone up a little but it's not a huge improvement.
Performance after 100 optimization iterations
So let's perform 100 optimization iterations and we just perform one so we perform another 99.
In [47]:
optimize(num_iterations=99) # We already performed 1 iteration above.
Out [47]:
Time usage: 0:00:05
Then let's calculate and print the classification accuracy on the test-set
In [48]:
print_test_accuracy(show_example_errors=True)
Out [48]:
Accuracy on Test-Set: 66.3% (6634 / 10000)
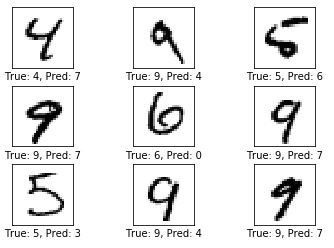
Example errors:
It's up to 66.3% so we have correctly classified about 6634 images out of the 10000 images in the test-set.
And the image above some of the examples of the mis-classified images so that is one that we have problems with in the first tutorial as well, it's really a 4 but the convolutional neural network has classified it as a 7, so the first one is difficult because it's very badly drawn but the other ones really should be classified correctly.
Performance after 1000 optimization iterations
Let's perform some more optimization iteration so we perform a 1000 in total and we already performed 100 so we just do another 900.
In [49]:
optimize(num_iterations=900) # We performed 100 iterations above.
Out [49]:
Optimization Iteration:    101, Training Accuracy:  62.5%
Optimization Iteration:    201, Training Accuracy:  85.9%
Optimization Iteration:    301, Training Accuracy:  89.1%
Optimization Iteration:    401, Training Accuracy:  89.1%
Optimization Iteration:    501, Training Accuracy:  89.1%
Optimization Iteration:    601, Training Accuracy:  89.1%
Optimization Iteration:    701, Training Accuracy:  82.8%
Optimization Iteration:    801, Training Accuracy:  87.5%
Optimization Iteration:    901, Training Accuracy:  96.9%
Time usage: 0:00:04
In [50]:
print_test_accuracy(show_example_errors=True)
Out [50]:
Accuracy on Test-Set: 93.3% (9329 / 10000)
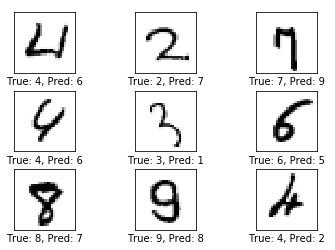
Example errors:
This takes 4 seconds and they get classification accuracy is 93.3% on the test-set so it means that we have correctly classified almost 9329 images out of the 10000
So we are still having problem with the 4 now we're classifying it as a 6 and next one should be a 2 but we classified it as a 7 as well next one is a 7 but we say it's a 9 and so on. So the convolutional network still needs to be optimized quite a bit.
Performance after 10,000 optimization iterations
So let's try and perform 10000 optimization iterations and we already performed 1000 so we just do another 9000
In [51]:
optimize(num_iterations=9000) # We performed 1000 iterations above.
Out [51]:
Optimization Iteration:   1001, Training Accuracy:  93.8%
Optimization Iteration:   1101, Training Accuracy:  92.2%
Optimization Iteration:   1201, Training Accuracy:  95.3%
Optimization Iteration:   1301, Training Accuracy:  96.9%
Optimization Iteration:   1401, Training Accuracy:  98.4%
Optimization Iteration:   1501, Training Accuracy:  96.9%
Optimization Iteration:   1601, Training Accuracy: 100.0%
Optimization Iteration:   1701, Training Accuracy:  95.3%
Optimization Iteration:   1801, Training Accuracy:  96.9%
Optimization Iteration:   1901, Training Accuracy:  98.4%
Optimization Iteration:   2001, Training Accuracy:  96.9%
Optimization Iteration:   2101, Training Accuracy: 100.0%
Optimization Iteration:   2201, Training Accuracy: 100.0%
Optimization Iteration:   2301, Training Accuracy: 100.0%
Optimization Iteration:   2401, Training Accuracy:  96.9%
Optimization Iteration:   2501, Training Accuracy:  98.4%
Optimization Iteration:   2601, Training Accuracy:  95.3%
Optimization Iteration:   2701, Training Accuracy:  96.9%
Optimization Iteration:   2801, Training Accuracy:  98.4%
Optimization Iteration:   2901, Training Accuracy:  98.4%
Optimization Iteration:   3001, Training Accuracy:  95.3%
Optimization Iteration:   3101, Training Accuracy:  98.4%
Optimization Iteration:   3201, Training Accuracy:  96.9%
Optimization Iteration:   3301, Training Accuracy:  98.4%
Optimization Iteration:   3401, Training Accuracy:  93.8%
Optimization Iteration:   3501, Training Accuracy:  95.3%
Optimization Iteration:   3601, Training Accuracy: 100.0%
Optimization Iteration:   3701, Training Accuracy:  95.3%
Optimization Iteration:   3801, Training Accuracy:  98.4%
Optimization Iteration:   3901, Training Accuracy:  96.9%
Optimization Iteration:   4001, Training Accuracy:  98.4%
Optimization Iteration:   4101, Training Accuracy:  98.4%
Optimization Iteration:   4201, Training Accuracy:  96.9%
Optimization Iteration:   4301, Training Accuracy: 100.0%
Optimization Iteration:   4401, Training Accuracy:  93.8%
Optimization Iteration:   4501, Training Accuracy:  98.4%
Optimization Iteration:   4601, Training Accuracy: 100.0%
Optimization Iteration:   4701, Training Accuracy:  98.4%
Optimization Iteration:   4801, Training Accuracy: 100.0%
Optimization Iteration:   4901, Training Accuracy: 100.0%
Optimization Iteration:   5001, Training Accuracy:  96.9%
Optimization Iteration:   5101, Training Accuracy:  98.4%
Optimization Iteration:   5201, Training Accuracy:  95.3%
Optimization Iteration:   5301, Training Accuracy:  98.4%
Optimization Iteration:   5401, Training Accuracy:  96.9%
Optimization Iteration:   5501, Training Accuracy:  96.9%
Optimization Iteration:   5601, Training Accuracy:  98.4%
Optimization Iteration:   5701, Training Accuracy:  96.9%
Optimization Iteration:   5801, Training Accuracy: 100.0%
Optimization Iteration:   5901, Training Accuracy:  96.9%
Optimization Iteration:   6001, Training Accuracy:  98.4%
Optimization Iteration:   6101, Training Accuracy:  96.9%
Optimization Iteration:   6201, Training Accuracy:  96.9%
Optimization Iteration:   6301, Training Accuracy:  96.9%
Optimization Iteration:   6401, Training Accuracy:  98.4%
Optimization Iteration:   6501, Training Accuracy:  98.4%
Optimization Iteration:   6601, Training Accuracy:  98.4%
Optimization Iteration:   6701, Training Accuracy:  98.4%
Optimization Iteration:   6801, Training Accuracy:  96.9%
Optimization Iteration:   6901, Training Accuracy: 100.0%
Optimization Iteration:   7001, Training Accuracy: 100.0%
Optimization Iteration:   7101, Training Accuracy: 100.0%
Optimization Iteration:   7201, Training Accuracy:  98.4%
Optimization Iteration:   7301, Training Accuracy: 100.0%
Optimization Iteration:   7401, Training Accuracy: 100.0%
Optimization Iteration:   7501, Training Accuracy:  98.4%
Optimization Iteration:   7601, Training Accuracy: 100.0%
Optimization Iteration:   7701, Training Accuracy:  98.4%
Optimization Iteration:   7801, Training Accuracy:  96.9%
Optimization Iteration:   7901, Training Accuracy:  98.4%
Optimization Iteration:   8001, Training Accuracy:  98.4%
Optimization Iteration:   8101, Training Accuracy: 100.0%
Optimization Iteration:   8201, Training Accuracy: 100.0%
Optimization Iteration:   8301, Training Accuracy:  96.9%
Optimization Iteration:   8401, Training Accuracy:  98.4%
Optimization Iteration:   8501, Training Accuracy:  95.3%
Optimization Iteration:   8601, Training Accuracy: 100.0%
Optimization Iteration:   8701, Training Accuracy: 100.0%
Optimization Iteration:   8801, Training Accuracy:  93.8%
Optimization Iteration:   8901, Training Accuracy: 100.0%
Optimization Iteration:   9001, Training Accuracy: 100.0%
Optimization Iteration:   9101, Training Accuracy: 100.0%
Optimization Iteration:   9201, Training Accuracy: 100.0%
Optimization Iteration:   9301, Training Accuracy: 100.0%
Optimization Iteration:   9401, Training Accuracy:  98.4%
Optimization Iteration:   9501, Training Accuracy: 100.0%
Optimization Iteration:   9601, Training Accuracy:  98.4%
Optimization Iteration:   9701, Training Accuracy:  98.4%
Optimization Iteration:   9801, Training Accuracy:  96.9%
Optimization Iteration:   9901, Training Accuracy:  95.3%
Time usage: 0:09:27
In [52]:
print_test_accuracy(show_example_errors=True,
                    show_confusion_matrix=True)
Out [52]:
Accuracy on Test-Set: 98.5% (9852 / 10000)
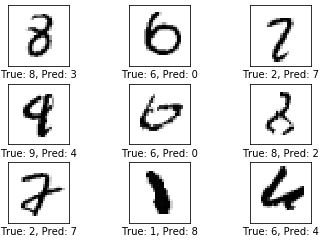
Example errors:
Now we have the classification accuracy on the test-set is 98.5% so we have correctly classified 9852 images out of 10000
Let's look at some of the images that have been mis-classified above we have a 6 which the network classified as a 0 and this is quite bad because this really cannot be anything except a 6 the next one is not so obvious it is registered in the data-set as being a 2 but we classified it as a 7 and I have to say that is sort of on the borderline because that could be a 7
So the network is still not perfect but it's a lot better than what we did with the simple linear model in the first tutorial.
Confusion Matrix:
[[ 970    0    1    0    0    2    2    1    4    0]
 [   0 1127    3    0    2    0    1    1    1    0]
 [   0    2 1022    1    2    0    0    4    1    0]
 [   0    0    2  999    0    3    0    4    2    0]
 [   0    0    0    0  982    0    0    0    0    0]
 [   1    0    1    7    1  879    1    1    0    1]
 [   4    2    1    0   12    8  931    0    0    0]
 [   0    1    5    0    1    0    0 1018    1    2]
 [   3    1    3    3    4    3    0    3  950    4]
 [   1    4    0    1   18    3    0    6    2  974]]
Visualization of Weights and Layers
So let's try and better understand what is happening in the convolutional neural network so we will try and visualize the weights and the output of the convolutional layers.
Helper-function for plotting convolutional weights
In [53]:
def plot_conv_weights(weights, input_channel=0):
    # Assume weights are TensorFlow ops for 4-dim variables
    # e.g. weights_conv1 or weights_conv2.

    # Retrieve the values of the weight-variables from TensorFlow.
    # A feed-dict is not necessary because nothing is calculated.
    w = session.run(weights)

    # Get the lowest and highest values for the weights.
    # This is used to correct the colour intensity across
    # the images so they can be compared with each other.
    w_min = np.min(w)
    w_max = np.max(w)

    # Number of filters used in the conv. layer.
    num_filters = w.shape[3]

    # Number of grids to plot.
    # Rounded-up, square-root of the number of filters.
    num_grids = math.ceil(math.sqrt(num_filters))

    # Create figure with a grid of sub-plots.
    fig, axes = plt.subplots(num_grids, num_grids)

    # Plot all the filter-weights.
    for i, ax in enumerate(axes.flat):
        # Only plot the valid filter-weights.
        if i<num_filters:
            # Get the weights for the i'th filter of the input channel.
            # See new_conv_layer() for details on the format
            # of this 4-dim tensor.
            img = w[:, :, input_channel, i]

            # Plot image.
            ax.imshow(img, vmin=w_min, vmax=w_max,
                      interpolation='nearest', cmap='seismic')

        # Remove ticks from the plot.
        ax.set_xticks([])
        ax.set_yticks([])

    # Ensure the plot is shown correctly with multiple plots
    # in a single Notebook cell.
    plt.show()
So we have a helper-function for plotting the convolution on weights and it takes the tensorflow object as the weights input and then it takes the input_channel that we want to show
I won't go through what does but again it is thoroughly commented so you can read the source code.
Helper-function for plotting the output of a convolutional layer
Here we have another helper-function for plotting the output of a convolutional layer and again we take a tensorflow object as a layer and then we take some input from for example there test-set and then we make a feed-dict and we calculate the output of the layer and then we plot it
In [54]:
def plot_conv_layer(layer, image):
    # Assume layer is a TensorFlow op that outputs a 4-dim tensor
    # which is the output of a convolutional layer,
    # e.g. layer_conv1 or layer_conv2.

    # Create a feed-dict containing just one image.
    # Note that we don't need to feed y_true because it is
    # not used in this calculation.
    feed_dict = {x: [image]}

    # Calculate and retrieve the output values of the layer
    # when inputting that image.
    values = session.run(layer, feed_dict=feed_dict)

    # Number of filters used in the conv. layer.
    num_filters = values.shape[3]

    # Number of grids to plot.
    # Rounded-up, square-root of the number of filters.
    num_grids = math.ceil(math.sqrt(num_filters))

    # Create figure with a grid of sub-plots.
    fig, axes = plt.subplots(num_grids, num_grids)

    # Plot the output images of all the filters.
    for i, ax in enumerate(axes.flat):
        # Only plot the images for valid filters.
        if i<num_filters:
            # Get the output image of using the i'th filter.
            # See new_conv_layer() for details on the format
            # of this 4-dim tensor.
            img = values[0, :, :, i]

            # Plot image.
            ax.imshow(img, interpolation='nearest', cmap='binary')

        # Remove ticks from the plot.
        ax.set_xticks([])
        ax.set_yticks([])

    # Ensure the plot is shown correctly with multiple plots
    # in a single Notebook cell.
    plt.show()
Input Images
Helper-function for plotting an image.
In [55]:
def plot_image(image):
    plt.imshow(image.reshape(img_shape),
               interpolation='nearest',
               cmap='binary')

    plt.show()
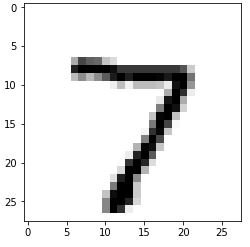
Plot an image from the test-set which will be used as an example below.
In [56]:
image1 = data.test.images[0]
plot_image(image1)
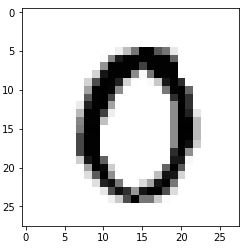
Plot another example image from the test-set
In [57]:
image2 = data.test.images[13]
plot_image(image2)
Convolution Layer 1
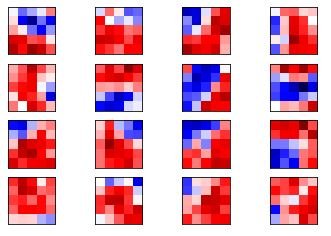
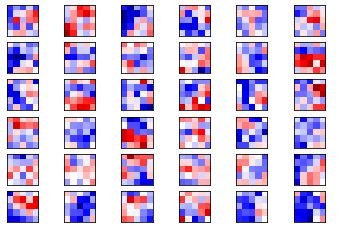
Now plot the filter-weights for the first convolutional layer.
Note that positive weights are red and negative weights are blue.
In [58]:
plot_conv_weights(weights=weights_conv1)
Remember that we have 16 filters and each of them is 5 x 5 pixels . Applying each of these convolutional filters to the first input image gives the following output images, which are then used as input to the second convolutional layer.
In [59]:
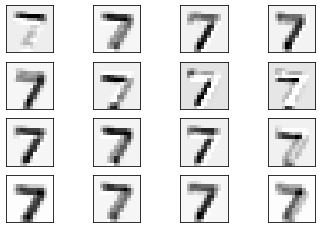
plot_conv_layer(layer=layer_conv1, image=image1)
If we use these convolutional filters on the first input image which was a 7 then we get the result, so we get 16 output images and remember that these have also been pool so that they are now half the resolution of the input image so these only 14 x 14 pixels, and it's a bit difficult to see what is actually happening but in the image it looks like it has recognized.
In [60]:
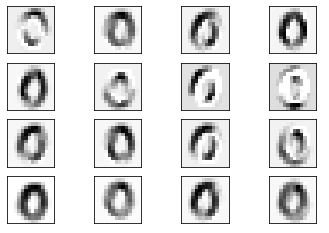
plot_conv_layer(layer=layer_conv1, image=image2)
Convolution Layer 2
Now plot the filter-weights for the second convolutional layer.
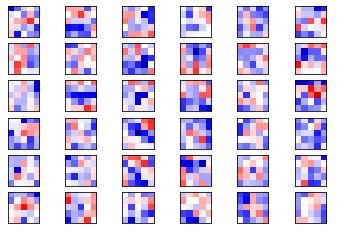
There are 16 output channels from the first conv-layer, which means there are 16 input channels to the second conv-layer. The second conv-layer has a set of filter-weights for each of its input channels. We start by plotting the filter-weigths for the first channel.
Note again that positive weights are red and negative weights are blue.
In [61]:
plot_conv_weights(weights=weights_conv2, input_channel=0)
There are 16 input channels to the second convolutional layer, so we can make another 15 plots of filter-weights like this. We just make one more with the filter-weights for the second channel.
In [62]:
plot_conv_weights(weights=weights_conv2, input_channel=1)
It can be difficult to understand and keep track of how these filters are applied because of the high dimensionality.
Applying these convolutional filters to the images that were ouput from the first conv-layer gives the following images.
Note that these are down-sampled yet again to 7 x 7 pixels which is half the resolution of the images from the first conv-layer.
In [63]:
plot_conv_layer(layer=layer_conv2, image=image1)
And these are the results of applying the filter-weights to the second image.
In [64]:
plot_conv_layer(layer=layer_conv2, image=image2)
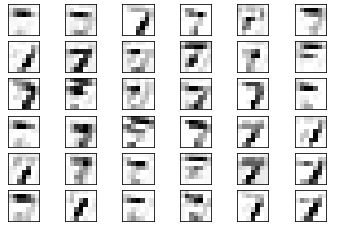
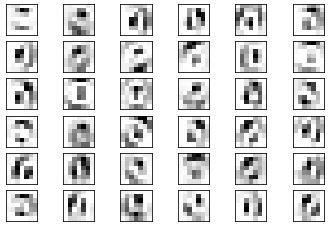
From these images, it looks like the second convolutional layer might detect lines and patterns in the input images, which are less sensitive to local variations in the original input images.
These images are then flattened and input to the fully-connected layer, but that is not shown here.
Close TensorFlow Session
In [65]:
session.close()
Thank you for reading this post, I hope you can understand, and enjoy it.
Posted on Utopian.io - Rewarding Open Source Contributors
Your contribution has been rejected due to plagiarism.
After checking your contribution, we discovered the codes you wrote are also fairly available on the web in several sites with 100% exact match.
Unfortunately, I have to reject this contribution. Any other contribution that includes plagiarism may get your account banned on Utopian. Permanently.
Need help? Write a ticket on https://support.utopian.io.
Chat with us on Discord.
[utopian-moderator]
Downvoting a post can decrease pending rewards and make it less visible. Common reasons:
Submit