Statsmodels is a powerful python library that to this day has many different statistical methods implemented. This library makes python a statistics software package that can actually compete with others like Stata and R. Even though there are some missing models, it provides base classes that can be used to extend its functionalities and implement new methods without reinventing the wheel. This post is a translation an improves on this original article by me.
What Will I Learn?
- How to make maximum likelihood models in python with Statsmodels library.
- About polychoric correlation applications and implementation.
Requirements
- Medium python knowledge
- Basic experience with statsmodels
- Some statistics knowledge (perhaps some solid theoretical knowledge about basic statistics)
- The intention to seek for alternatives to other stats software packages.
Difficulty
- Intermediate
Introduction to polychoric correlation
Ordinal qualitative scales are very common in surveys and other data (e.g. [Good, Meh, Bad]). These kind of variables are hard to model numerically. Some people even convert them to integer values, however this is a poor strategy because it assumes the space between each ordinal level is the same.
If we agree to handle these variables as if they were continous, we shouldn't be careless about it. Pearson, one of the most fundamental statisticians in history, had already thought of these more than a century ago and he developed tetrachoric corelation (which arises when there are two variables with two ordinal levels each. i.e. 2x2 contingency tables). This weird name he invented comes from an infinite series he used to estimate the correlation term from this problem. If you want to see the details, check out references [3, 4, 5]. The generalization of this tetrachoric correlation to more than 2 levels for each variable was named polychoric correlation. Bottomline, if you consider each of the ordinal levels are spaced equally, then you may obtain a non-normal distribution which removes our hopes to calculate correlation based on the assumption of having normal distributions.
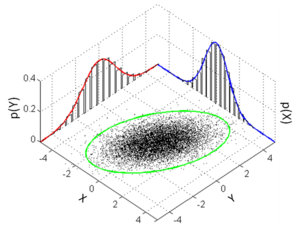
To develop the polychoric correlation of 2 ordinal variables we are going to assume that each variable has a latent continuous variable following a normal distribution, and that both variables are related by a bivariate normal distribution with a correlation that we will refer to as "rho" . The following is the bivariate normal distribution and rho is the correlation between the two variables.

According to Uebersax [6], X^2 independence test (chi squared) is equivalent to probe that polychoric correlation is equal to zero. So if you just want to probe/disprobe this simple case, you don't need to estimate polychoric correlation.
One of the most interesting applications of the polychoric correlation is its use in PCA, Factor Analysis and other latent models that involve ordinal variables. I have not heard of it, but this kind of latent variable idea could be introduced to neural networks as well.
In [1] , Pearson demonstrates that using the common correlation formula for ordinal variables converted to equally spaced numbers has a bias towards zero, which means, it underestimates the correlation.
MLE for estimating the Polychoric correlation
Now moving to the implementation, Polychoric correlation is not as simple as tetrachoric correlation, which we said can be calculated with an infinite series. The calculations get really ugly, and it is better to use optimization methods. Olsson [2] describes how to do this and we are going to follow his lead to solve this problem. There won't be mathematical demonstrations here, but only the actual code.
from statsmodels.base.model import GenericLikelihoodModel
import matplotlib as mlp
import matplotlib.pyplot as plt
from scipy import stats
import numpy as np
To implement the model we must extend the class "GenericLikelihoodModel", from statsmodels python package. The documentation for this class can be found here and some basic examples can be found here. The most important method to implement is "loglikeobs", which calculate the log likelihood for each observation in the input dataset. If needed, you should also override the init method to prepare your model. I also have implemented the fit method in order to set starting regression values.
class PolychoricCorrMLE(GenericLikelihoodModel):
    """
    Based on the paper Maximum Likelihood Estimation of the Polychoric Correlation Coefficient by Olsson U.
    Tested it with nm and powell algorithms, obtaining good results with both.
    """
    def __init__(self, endog, ** kwds):
        """
        endog will be the contingency table.
        exog not used

        """
        if len(endog.shape) != 2 or endog.shape[0] < 2 or endog.shape[1] < 2:
            raise "Matrix expected with more than 2 columns and more than 2 rows"
        # Initialize thresholds based on inverse normal CDF on marginal probabilities
        self.endog = endog
        marginalColsF = np.sum(endog, axis= 0)
        marginalRowsF = np.sum(endog, axis= 1)
        marginalColsP = marginalColsF/np.sum(marginalColsF)
        marginalRowsP = marginalRowsF/np.sum(marginalRowsF)
        self.init_zCols = stats.norm.ppf(np.cumsum(np.hstack([[0.0],marginalColsP])) )
        self.init_zRows = stats.norm.ppf(np.cumsum(np.hstack([[0.0],marginalRowsP])) )
        super(PolychoricCorrMLE, self).__init__(endog, None, **kwds)
    def nloglikeobs(self, params):
        # Pay attention to these 3 lines, it shows how "params" array is organized:
        rho = params[-1]
        zCols =np.hstack([-np.inf, params[0:self.endog.shape[1]-1], np.inf])
        zRows =np.hstack([-np.inf, params[self.endog.shape[0]-1:self.endog.shape[0]+self.endog.shape[1]-2], np.inf])
        ll = []
        for i in range(self.endog.shape[1]):
            for j in range(self.endog.shape[0]):
                error, p_ij, inform = stats.mvn.mvndst([zCols[i], zRows[j]], [zCols[i+1],zRows[j+1]],
                                                     [0 if i == 0 else 1 if (i+1) == self.endog.shape[0] else 2,
                                                      0 if j == 0 else 1 if (j+1) == self.endog.shape[1] else 2], rho)
                ll.append(-self.endog[j,i] * np.log(p_ij))

        return np.array(ll)
    def fit(self, start_params=None, maxiter=10000, maxfun=5000, **kwds):
        if start_params == None:
            # Reasonable starting values
            start_params = np.hstack([self.init_zCols[1:-1], self.init_zRows[1:-1], 0.0])
        return super(PolychoricCorrMLE, self).fit(start_params=start_params,
                                     maxiter=maxiter, maxfun=maxfun,
                                     **kwds)
The initialization method calculates the z-values for each level of the ordinal variables. The manipulation of the "params" variable is key in this code. In the "fit" method, the params are initialized with the z-values calculated in the "init" method and with an initial correlation of 0. Then, in the "loglikeobs" method the params are recovered and are put in zCols, zRows and rho variables. The likelihood of these parameters is calculated by using "stats.mvn.mvndst" which by the way is curiously based on a very old FORTRAN code which had a strange usage. This method has to calculate the probability of observing each one of the input data observations given the bivariate distribution modeled by the parameters. p_ij follows the equation found in Olsson paper:

Which represents the probability of the observation based on the thresholds (a's and b's), and Phi_2 is the CDF of the bivariate normal with the rho parameter.
That's all for the MLE model. The statsmodels class handles the rest for us. Simple enough, now moving on to some usage examples.
Examples: calculating the correlation in a 2x2 contingency table
This example appears in [6] (http://john-uebersax.com/stat/tetra.htm#ex1) and it will help us have a reliable reference to compare with. In this example, there are two classifiers which determinate the presence of schizophrenia in an individual. Now, let's say there is a sample of 100 patients evaluated and each of the classifiers will determine which of them are schizophrenic.
This is represented in the following table:
 --------------------------
                  Rater 2
                 ---------
      Rater 1     -     +   Total
      ---------------------------
        -        40    10     50

        +        20    30     50
      --------------------------
      Total      60    40    100
      --------------------------
According to Uebersax article, results should be:
    rho       0.6071  (0.1152)
    Rater 1   0.0000  (0.1253)
    Rater 2   0.2533  (0.1268)
Where rho is the polychoric correlation between the two raters and the other two quantities are the thresholds of their categories. What we want to find out is the level of correlation of the two raters in order to check whether they are equivalent. Perharps Rater 1 is less expensive than Rater 2 and a high correlation could justify using it instead of Rater 2. We could also compare the thresholds in order to see if they also agree on their categorization. Other application could be to select independent classifiers to include in a larger model. If you use two classifiers that are highly correlated in a logistic regression, your covariate estimates won't be reliable and you may get variance inflation, or you may discard them in a PCA. Simple Pearson correlation for this example is 0.4 (note it is underestimated).
Let's test our polychoric correlation MLE model:
t = PolychoricCorrMLE(np.array([[40,10], [20,30]]))
r = t.fit()
print("\n".join([ "%s\t%f\t(%f)"%(a,b,c) for a,b,c in zip(["Rater 2", "Rater 1", "rho"], r.params, r.bse)]))
Result:
Optimization terminated successfully.
         Current function value: 63.992711
         Iterations: 102
         Function evaluations: 185

Rater 2 0.253359    (0.126804)
Rater 1 0.000003    (0.125331)
rho 0.607117    (0.115220)
Note that the input is the actual contingency table. Results look great. Some minor differences are seen, but optimization is always improving (hopefully not getting worst) and that is why as algorithms get better, results of the same problems vary slightly. Sometimes different implementations of the same algorithm show slightly different results as well.
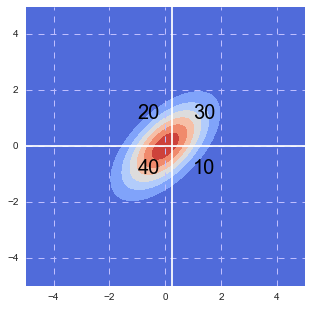
To help you visualize this, I have generate the folloing image, which represents the contingency table graphically. It is basically a bivariate normal distribution adjusted to fit the given distribution in the four cells.

The second example in Uebersax article is also tested with this code:
t = PolychoricCorrMLE(np.array([[58,52,1], [26,58,3],[8,12,9]]))
r = t.fit()
print("rho :  ", r.params[-1], "(",r.bse[-1],")")
Result:
Optimization terminated successfully.
         Current function value: 135.506478
         Iterations: 219
         Function evaluations: 349
rho :   0.419142967264 ( 0.0761500057453 )
This result also match Uebersax article's result.
Conclusion
MLE models can be easily implemented in python with statsmodels package. You only need to implement the log likelihood function and handle any initialization. Also, polychoric correlation estimation is the right way to measure the independence between ordinal categorical variables. You could even measure the correlation between a continuous normal variable and an ordinal variable with some small modifications of this code.
References
- [1] Angeles G. Kolenikov S. (2014) The Use of Discrete Data in PCA: Theory, Simulations, and Applications to Socioeconomic Indices
- [2] Olsson U. (1979) Maximum Likelihood Estimation of the Polychoric Correlation Coefficient.
- [3] Pearson K. (1900) Mathematical Contributions to the Theory of Evolution. VII. On the Correlation of Characters not Quantitatively Measurable
- [4] Pearson K. (1922) On Polychoric Coefficients of Correlation.
- [5] Richie-Scott A. (1918) The Correlation Coefficient of a Polychoric Table.
- [6] Uebersax J. (2015) Introduction to the Tetrachoric and Polychoric Correlation Coefficients
Posted on Utopian.io - Rewarding Open Source Contributors

Hey @elguille! Thank you for the great work you've done!
We're already looking forward to your next contribution!
Fully Decentralized Rewards
We hope you will take the time to share your expertise and knowledge by rating contributions made by others on Utopian.io to help us reward the best contributions together.
Utopian Witness!
Vote for Utopian Witness! We are made of developers, system administrators, entrepreneurs, artists, content creators, thinkers. We embrace every nationality, mindset and belief.
Want to chat? Join us on Discord https://discord.me/utopian-io
Downvoting a post can decrease pending rewards and make it less visible. Common reasons:
Submit
Thank you for the contribution. It has been reviewed.
Need help? Write a ticket on https://support.utopian.io.
Chat with us on Discord.
[utopian-moderator]
Downvoting a post can decrease pending rewards and make it less visible. Common reasons:
Submit
Thanks ! I have fixed some grammar errors btw :)
Downvoting a post can decrease pending rewards and make it less visible. Common reasons:
Submit
Impressive, you make it look very easy a very difficult job. Congratulations for it.
I have nominated you to participate in this challenge, I leave the link below, please if you have already participated or can not do it, let me know to pass the ball to another person.
A hug my friend.
https://steemit.com/spanish/@reinaldoverdu/reto-el-origen-de-mi-nombre-de-usuario-en-steemit
Te deseo un feliz dia y una mejor vida
Downvoting a post can decrease pending rewards and make it less visible. Common reasons:
Submit