What Will I Learn?
- Develop Geo Choropleth Chart
- Parse CSV Data in d3.js
- Parse JSON Data in d3.js
Requirements
- Basics of HTML and CSS
- Basics of Crossfilter.js
- JavaScript Essentials
Difficulty
- Intermediate
Tutorial Contents
- What is Geo Choropleth Chart ?
- Create Working Environment
- Develop Geo Choropleth Chart
What is Geo Choropleth Chart ?
A choropleth map is a presentation of map in which areas are colored or patterned in proportion to the measurement of the statistical variable being displayed on the map, such as per-capita income, the population by area.
Choropleth maps provide an easy way to compare the different areas on the basis of statistical data. How a measurement varies across a geographic area or show the level of variability within a region.
Today, we are going to develop a Choropleth Chart of "US Venture Capital Landscape 2011", Different regions can be shaded differently based on different calculation. Here, for our tutorial we'll work on two formats of data , CSV and JSON. The CSV file provide the us statistical data and JSON file provide us the information that'll help us to develop our chart. First download the these two files , CSV
and JSON.
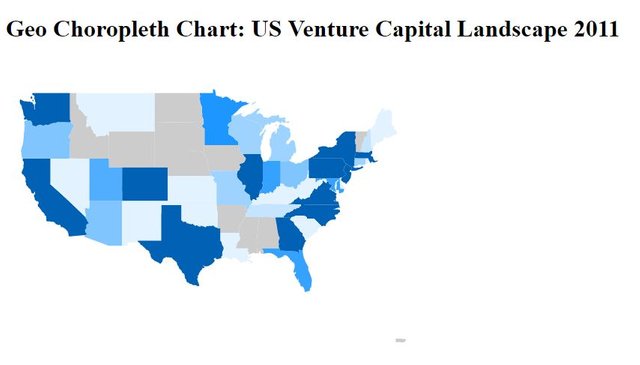
Create Working Environment
Before we move to our chart, we'll have to create a working environment that'll allow us to develop our chart. Firs of all open your text editor, create a file with name geoChoroplethChart.html and save it in your working directory.
Next up, write all the necessary HTML code to work with HTML files.
<!DOCTYPE html>
<html lang="EN">
    <head>
      <meta charset="utf-8">
      <title>Geo Choropleth Chart</title>
    </head>
    <body>
    <body>
<html>
Now write the code for heading of the page and for the div in which you want to show your Geo Choropleth Chart. Write this code withing the body tag.
        <h1>Geo Choropleth Chart: US Venture Capital Landscape 2011</h1>
        <div id="geoChoroplethChart"></div>
Now link your file with the dc.js library, here you'v to link two dc.js files one for its js file an the other one is css file. Add this code withing the <head> tag
      <script type="text/javascript" src="https://cdnjs.cloudflare.com/ajax/libs/dc/2.1.9/dc.min.js"></script>
      <link rel="stylesheet" type="text/css" href="https://cdnjs.cloudflare.com/ajax/libs/dc/2.1.9/dc.min.css" />
But dc.js didn't work alone, for this you've to link other two libraries the dc.j depends upon, d3.js and crossfilter.js. Also link these two.
      <script type="text/javascript" src="https://cdnjs.cloudflare.com/ajax/libs/d3/3.5.1/d3.min.js"></script>
      <script type="text/javascript" src="https://cdnjs.cloudflare.com/ajax/libs/crossfilter/1.3.12/crossfilter.min.js"></script>
Now, you're able to work with dc.js.
Start developing Geo Choropleth Chart
Above we've downloaded required files set up our working environment to work with dc.js, now we'll move to our chart. First we'll work on our CSV file, parse the csv data that we able to use this data to develop our chart. D3.JS allow us to parse the csv data, it provide us a method csv([]). Use this method.
d3.csv("vc.csv", function(error, csvData){
              // The rest of the code will be written withing this body....
                });
You can see we passed two argument to csv([]) method, first is the name of the csv file and the other one is a method. The method itself contains two arguments: error it contains the errors if there exists and csvData its contains the csv file parsed data. You can check this data in console by writing this code.
d3.csv("vc.csv", function(error, csvData){
                console.log(csvData);
                });
Console View:
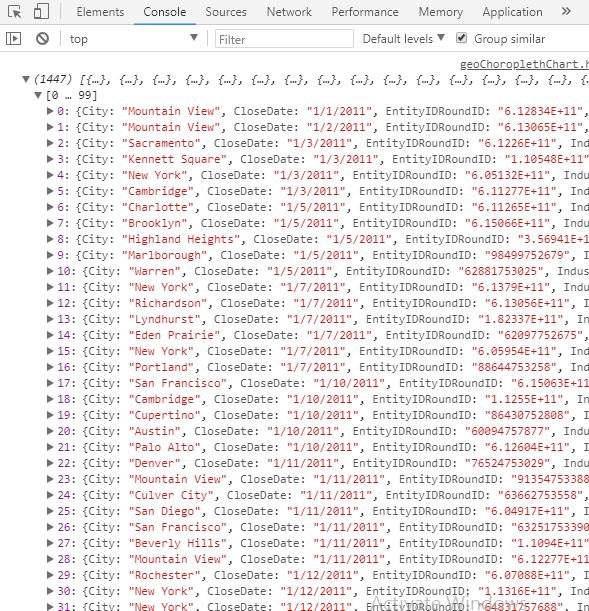
If you checked out our previous tutorial we examine that the parsed data return to us in string, this creates the problem for us when we are working with numerical data. You can see the Raised property in our data is in numerical format. So, we'll have to do type conversion. There are couple of ways to do this but we find this better.
                csvData.forEach(function(d){
                    d.Raised = +d.Raised
                });
Now, pass this our parsed data to the crossfilter.js that'll allow us to create dimension and grouped our data.
var facts = crossfilter(csvData);
Its time to create dimension, we'll create the dimension by states.
var dimensionByState = facts.dimension(function(d){ return d.State})
Now grouped the data, we will sum up the Raised fund by states.
var groupByRaised = dimensionByState.group().reduceSum(function(d){ return d.Raised});
Here above we completed our word with csv data, now we will work with JSON data that allow us to create US map.
First we parse the json data with the help of d3.js library, the library gives us a method json([]). That allow us to parse the json data. This method works same like the csv([]) method, we've explained above how it works. Write this code.
                d3.json("us-states.json", function(error, jsonData){
            // dc.js code will be written here.
});
We've done our data related stuff , its time to develop our chart, create the object of geoChoroplethChart class and pass it the div's ID we created above. Also define the width and height of the chart.
                    var geoChoroplethChart = dc.geoChoroplethChart("#geoChoroplethChart")
                                .width(1024)
                                .height(600)
Now pass the dimension and group of the data that we create above from crossfilter.js library.
                   var geoChoroplethChart = dc.geoChoroplethChart("#geoChoroplethChart")
                               .width(1024)
                               .height(600)
                               .dimension(dimensionByState)
                               .group(groupByRaised)
Here, we are one step away from our chart, geoChoroplethChart give s us a special method
overlayGeoJson(json, name, keyAccessor), this method is mandatory to create our chart. The method allow us to insert a new GeoJson map layer, the method executed number times, depends upon the how much GeoJson data layers you have. If you overlay multiple layers with the same name the new overlay will override the existing one.
It takes three argumenst, geojsonData, name of the data and keyAccessor.
                d3.json("us-states.json", function(error, jsonData){


                    var geoChoroplethChart = dc.geoChoroplethChart("#geoChoroplethChart")
                                .width(1024)
                                .height(600)
                                .dimension(dimensionByState)
                                .group(groupByRaised)
                                .overlayGeoJson(jsonData.features, "State", function(d){
                                    return d.properties.name;
                                });

                        dc.renderAll();

                });
Output:
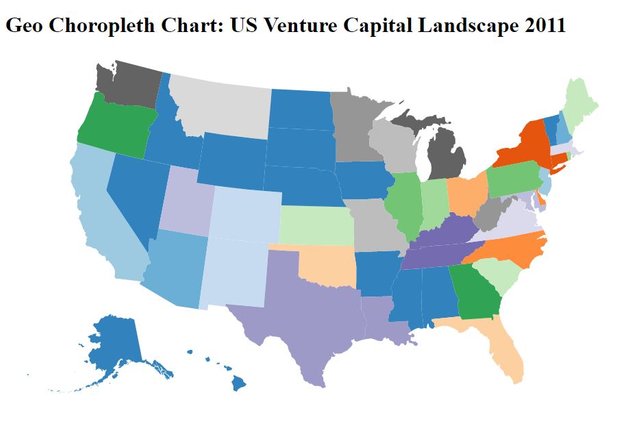
You can see the state are of represented by different colors depends the amount raised for each state. But if you want a single color of the map as in the first image of the tutorial. then add this code to your above code.
                              .colorDomain([0,200])
                              .colorCalculator(function(d){ return d ? geoChoroplethChart.colors()(d) : '#ccc'; });
- .colors([]) : set the, only show these colors.
- .colorDomain([]) : this method Set /et the current domain for the color mapping method.
- .colorCalculator([]): this method determining the min and max values as retrieved by .colorAccessor and sets the domain.
Output:
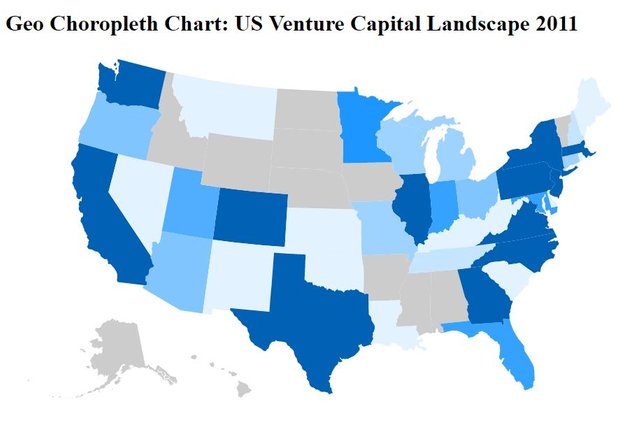
You can see colors the a set according to our requirement.
You can also set the projection of chart over world map, to do this
                    var centre = d3.geo.centroid(jsonData);
                    var projection = d3.geo.mercator().center(centre).scale(500).translate([200,100]);
Create the projection through d3.js, the library includes several common projections by default. Here we use the d3.geo.mercator you can use whatever you want
Now pass this project to our chart.
.projection(projection)
The code will :
var geoChoroplethChart = dc.geoChoroplethChart("#geoChoroplethChart")
                                .width(1024)
                                .height(600)
                                .dimension(dimensionByState)
                                .projection(projection)
                                .group(groupByRaised)
                                .overlayGeoJson(jsonData.features, "State", function(d){
                                    return d.properties.name;
                                })
                              .colors(d3.scale.quantize().range(["#E2F2FF","#C4E4FF","#9ED2FF","#81C5FF","#6BBAFF","#51AEFF","#36A2FF","#1E96FF","#0089FF","#0061B5"]))
                              .colorDomain([0,200])
                              .colorCalculator(function(d){ return d ? geoChoroplethChart.colors()(d) : '#ccc'; });
                        dc.renderAll();

                });
output:
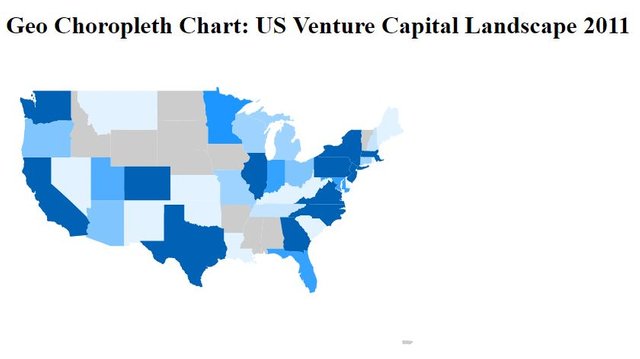
You can see our chart become little smaller and moved toward left, you can set the chart where ever you want by just changing the translate([]); method. Every projection in d3.js is also provided with translation.
Here we tried another projection to make you clear and easier for you to use. We use d3.geo.conicEqualArea . Replace this code with you old projection code,
var projection = d3.geo.conicEqualArea().center(centre).scale(500).translate([480, 250]);
Output:
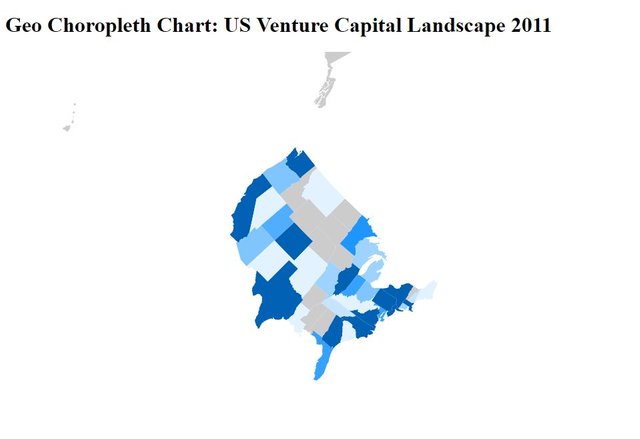
You can see how our view of the chart changes.
Source Code:
<!DOCTYPE html>
<html lang="EN">
    <head>
      <meta charset="utf-8">
      <title>Geo Choropleth Chart</title>
      <script type="text/javascript" src="https://cdnjs.cloudflare.com/ajax/libs/d3/3.5.1/d3.min.js"></script>
      <script type="text/javascript" src="https://cdnjs.cloudflare.com/ajax/libs/crossfilter/1.3.12/crossfilter.min.js"></script>
      <script type="text/javascript" src="https://cdnjs.cloudflare.com/ajax/libs/dc/2.1.9/dc.min.js"></script>
      <link rel="stylesheet" type="text/css" href="https://cdnjs.cloudflare.com/ajax/libs/dc/2.1.9/dc.min.css" />
    </head>
    <body>
        <h1>Geo Choropleth Chart: US Venture Capital Landscape 2011</h1>
        <div id="geoChoroplethChart"></div>

        <script type="text/javascript">
            // https://raw.githubusercontent.com/dc-js/dc.js/develop/web/vc/vc.csv
            // https://raw.githubusercontent.com/dc-js/dc.js/develop/web/geo/us-states.json
            d3.csv("vc.csv", function(error, csvData){

                console.log(csvData);

                csvData.forEach(function(d){
                    d.Raised = +d.Raised
                });

                var facts = crossfilter(csvData);

                var dimensionByState = facts.dimension(function(d){ return d.State})
                var groupByRaised = dimensionByState.group().reduceSum(function(d){ return d.Raised});

                d3.json("us-states.json", function(error, jsonData){
                    console.log(jsonData);

                    var centre = d3.geo.centroid(jsonData);
                    var projection = d3.geo.mercator().center(centre).scale(500).translate([200,100]);


                    var geoChoroplethChart = dc.geoChoroplethChart("#geoChoroplethChart")
                                .width(1024)
                                .height(600)
                                .dimension(dimensionByState)
                                .projection(projection)
                                .group(groupByRaised)
                                .overlayGeoJson(jsonData.features, "State", function(d){
                                    return d.properties.name;
                                })
                              .colors(d3.scale.quantize().range(["#E2F2FF","#C4E4FF","#9ED2FF","#81C5FF","#6BBAFF","#51AEFF","#36A2FF","#1E96FF","#0089FF","#0061B5"]))
                              .colorDomain([0,200])
                              .colorCalculator(function(d){ return d ? geoChoroplethChart.colors()(d) : '#ccc'; });
                        dc.renderAll();

                });

            });

        </script>

    </body>
</html>
Curriculum
Tutorial #10 Dive into DC.JS a JavaScript Library - Box Plot
Tutorial #9 Dive into DC.JS a JavaScript Library - Series Chart
Tutorial #8 Dive into DC.JS a JavaScript Library - Bubble Chart
Tutorial #7 Dive into DC.JS a JavaScript Library - Data Table
Tutorial #6 Dive into DC.JS a JavaScript Library - Stacked Bar Chart
Tutorial #5 Dive into DC.JS a JavaScript Library - Scatter Plot
Tutorial #4 Dive into DC.JS a JavaScript Library - Composite Chart [Left, Right]
Tutorial #3 Dive into DC.JS a JavaScript Library - Line Chart
Tutorial #2 Dive into DC.JS a JavaScript Library - Pie Chart
Tutorial #1 Dive into DC.JS a JavaScript Library - Bar Chart
Posted on Utopian.io - Rewarding Open Source Contributors
Thank you for the contribution. It has been approved.
You can contact us on Discord.
[utopian-moderator]
Downvoting a post can decrease pending rewards and make it less visible. Common reasons:
Submit
Hey @faad I am @utopian-io. I have just upvoted you!
Achievements
Suggestions
Get Noticed!
Community-Driven Witness!
I am the first and only Steem Community-Driven Witness. Participate on Discord. Lets GROW TOGETHER!
Up-vote this comment to grow my power and help Open Source contributions like this one. Want to chat? Join me on Discord https://discord.gg/Pc8HG9x
Downvoting a post can decrease pending rewards and make it less visible. Common reasons:
Submit