What Will I Learn?
- Heat Map Chart using dc.js
Requirements
- Basics for HTML and CSS
- Essentials of JavaScript
- Essentials of Crossfilter.js
- Knowledge about Statistical Data
Difficulty
- Intermediate
Tutorial Contents
- What is Heat Map Chart?
- Create Working Environment
- Develop Heat Map Chart
What is Heat Map Chart?
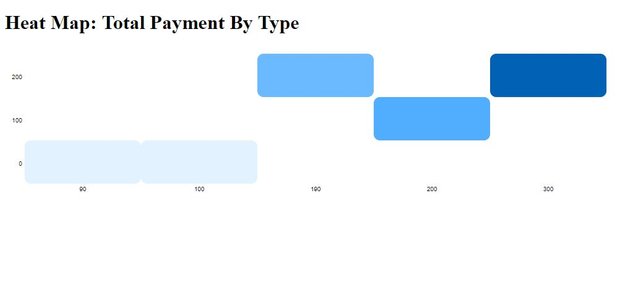
A Heat Map is a graphical representation of statistical data the individual value contained in a matrix are represented as colors. The heatmap is used to originated 2D display of the values in a data matrix. The higher extreme values represented by darker colors and lower extreme value represented by lighter colors.
Today, we are going to develop a heatmap from some json data.

Create Working Environment
First of all we have to develop an environment to work with dc.js. To do open your text editor and create a file with name heatMap.html save it your working directory.
After doing this write the necessary code that allow us to wok with HTML file.
<!DOCTYPE html>
<html lang="EN">
    <head>
      <meta charset="utf-8">
      <title>Heat Map</title>
    </head>
    <body>

    <body>
<html>
Now, write the code to heading of the page and for the div in which you want to show your chart. Write this code withing the body tag.
        <h1>Heat Map</h1>
        <div id="heatMap"></div>
Now link the dc.js library and other two libraries required to work with dc.js. These are crossfilter.js and d3.js . Write this code in the head tag.
      <script type="text/javascript" src="https://cdnjs.cloudflare.com/ajax/libs/d3/3.5.1/d3.min.js"></script>
      <script type="text/javascript" src="https://cdnjs.cloudflare.com/ajax/libs/crossfilter/1.3.12/crossfilter.min.js"></script>
      <script type="text/javascript" src="https://cdnjs.cloudflare.com/ajax/libs/dc/2.1.9/dc.min.js"></script>
      <link rel="stylesheet" type="text/css" href="https://cdnjs.cloudflare.com/ajax/libs/dc/2.1.9/dc.min.css" />
At the end of creating our working environment we need the json data on which we develop our chart. We have this data of some trisection, you can also use your own data.
        <script type="text/javascript">


          var paymentsRecord = [
          {date: "2011-11-14T16:17:54Z", quantity: 2, total: 190, tip: 100, type: "tab"},
          {date: "2011-11-14T16:20:19Z", quantity: 2, total: 190, tip: 100, type: "tab"},
          {date: "2011-11-14T16:28:54Z", quantity: 1, total: 300, tip: 200, type: "visa"},
          {date: "2011-11-14T16:30:43Z", quantity: 2, total: 90, tip: 0, type: "tab"},
          {date: "2011-11-14T16:48:46Z", quantity: 2, total: 90, tip: 0, type: "tab"},
          {date: "2011-11-14T16:53:41Z", quantity: 2, total: 90, tip: 0, type: "tab"},
          {date: "2011-11-14T16:54:06Z", quantity: 1, total: 100, tip: 0, type: "cash"},
          {date: "2011-11-14T16:58:03Z", quantity: 2, total: 90, tip: 0, type: "tab"},
          {date: "2011-11-14T17:07:21Z", quantity: 2, total: 90, tip: 0, type: "tab"},
          {date: "2011-11-14T17:22:59Z", quantity: 2, total: 90, tip: 0, type: "tab"},
          {date: "2011-11-14T17:25:45Z", quantity: 2, total: 200, tip: 0, type: "cash"},
          {date: "2011-11-14T17:29:52Z", quantity: 1, total: 200, tip: 100, type: "visa"}
        ];
        </script>
Develop Heat Map Chart
Once we created our working environment, now we'll move to develop our heatmap chart. Here above you can see our json formatted data we'll develop a chart: Tips against Total Payment.
At first, we feed our data to crossfilter.js that we can create dimension of data and grouped our data. To do this write the code.
var facts = crossfilter(paymentsRecord);
Now create dimension of the data, as we mentioned above we are going to develop a chart Tips against payment. So, here we create the dimension of total payment.
var dimensionByTotal = facts.dimension(function(d){ return d.total; });
Now its time to grouped our data on the basis of total payment given by customer and tips.
var groupByTotal = dimensionByTotal.group().reduceSum(function(d){ return d.tip; });
Above we done with all of our data related stuff, now its time to create our chart.
dc.js provide class heatMap to create a heat map chart. Create the object of heatMap class . and pass it the ID of the div that we create above.
var barChart = dc.heatMap('#heatMap')
Now set the width and height of the chart.
          var barChart = dc.heatMap('#heatMap')
                .width(1024)
                .height(250)
Now pass the dimension and group of data that we created above from corssfilter.sj.
          var barChart = dc.heatMap('#heatMap')
                .width(1024)
                .height(250)
                .dimension(dimensionByType)
                .group(groupByType)
At the end render the chart.
dc.renderAll();
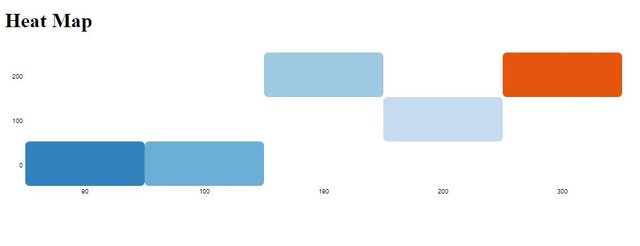
Output:

You can see the extreme value box shaded with orange color and lower value box with Cornflower Blue. You can also customize the color with .colors([]) methods. It takes array of colors that you want to fix for your chart. Here We done it as
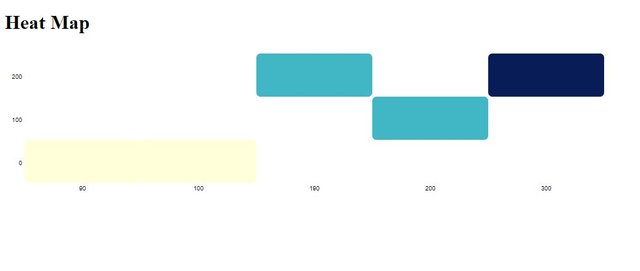
                        .colors(["#ffffd9","#edf8b1","#c7e9b4","#7fcdbb","#41b6c4","#1d91c0","#225ea8","#253494","#081d58"]
                .calculateColorDomain();
Output:

You can see higher value box colored Downriver and lowest value colored light Cumulus.
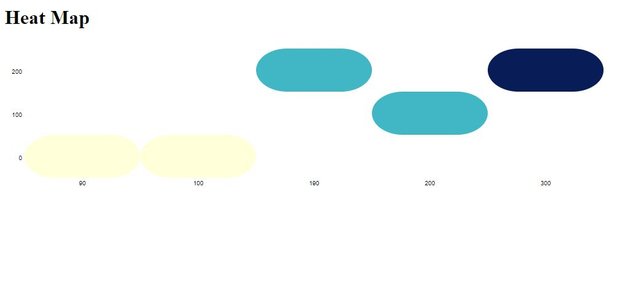
The other methods of heatMap Class is, you can change the border radius of the boxes with these methods, by default the value is 6.75, we changed it to 10. You can adjust it where you feel better for your chart.
                .xBorderRadius([50])
                 .yBorderRadius([50])
Output:

You can see border radius adjusted to 50pix.
Here follow is the full source code of the heatMap chart.
Source Code :
<!DOCTYPE html>
<html lang="EN">
    <head>
      <meta charset="utf-8">
      <title>Heat Map</title>
      <script type="text/javascript" src="https://cdnjs.cloudflare.com/ajax/libs/d3/3.5.1/d3.min.js"></script>
      <script type="text/javascript" src="https://cdnjs.cloudflare.com/ajax/libs/crossfilter/1.3.12/crossfilter.min.js"></script>
      <script type="text/javascript" src="https://cdnjs.cloudflare.com/ajax/libs/dc/2.1.9/dc.min.js"></script>
      <link rel="stylesheet" type="text/css" href="https://cdnjs.cloudflare.com/ajax/libs/dc/2.1.9/dc.min.css" />
    </head>
    <body>
        <h1>Heat Map</h1>
        <div id="heatMap"></div>

        <script type="text/javascript">


          var paymentsRecord = [
          {date: "2011-11-14T16:17:54Z", quantity: 2, total: 190, tip: 100, type: "tab"},
          {date: "2011-11-14T16:20:19Z", quantity: 2, total: 190, tip: 100, type: "tab"},
          {date: "2011-11-14T16:28:54Z", quantity: 1, total: 300, tip: 200, type: "visa"},
          {date: "2011-11-14T16:30:43Z", quantity: 2, total: 90, tip: 0, type: "tab"},
          {date: "2011-11-14T16:48:46Z", quantity: 2, total: 90, tip: 0, type: "tab"},
          {date: "2011-11-14T16:53:41Z", quantity: 2, total: 90, tip: 0, type: "tab"},
          {date: "2011-11-14T16:54:06Z", quantity: 1, total: 100, tip: 0, type: "cash"},
          {date: "2011-11-14T16:58:03Z", quantity: 2, total: 90, tip: 0, type: "tab"},
          {date: "2011-11-14T17:07:21Z", quantity: 2, total: 90, tip: 0, type: "tab"},
          {date: "2011-11-14T17:22:59Z", quantity: 2, total: 90, tip: 0, type: "tab"},
          {date: "2011-11-14T17:25:45Z", quantity: 2, total: 200, tip: 0, type: "cash"},
          {date: "2011-11-14T17:29:52Z", quantity: 1, total: 200, tip: 100, type: "visa"}
        ];

          var facts = crossfilter(paymentsRecord);

          var dimensionByType = facts.dimension(function(d){ return d.total; });
          var groupByType = dimensionByType.group().reduceSum(function(d){ return d.tip; });

          var barChart = dc.heatMap('#heatMap')
                .width(1024)
                .height(250)
                .dimension(dimensionByType)
                .group(groupByType)
                .title(function(d){ return "Total Payment: $" + d.key + " => Tip: $" +d.value; })
                // .xBorderRadius([10])
                // .yBorderRadius([10])
                //.rows([5])
                //.cols([1])
                .colors(["#ffffd9","#edf8b1","#c7e9b4","#7fcdbb","#41b6c4","#1d91c0","#225ea8","#253494","#081d58"])
                .calculateColorDomain();

            dc.renderAll();
        </script>

    </body>
</html>
Curriculum
Tutorial #11 Dive into DC.JS a JavaScript Library - Geo Choropleth Chart
Tutorial #10 Dive into DC.JS a JavaScript Library - Box Plot
Tutorial #9 Dive into DC.JS a JavaScript Library - Series Chart
Tutorial #8 Dive into DC.JS a JavaScript Library - Bubble Chart
Tutorial #7 Dive into DC.JS a JavaScript Library - Data Table
Tutorial #6 Dive into DC.JS a JavaScript Library - Stacked Bar Chart
Tutorial #5 Dive into DC.JS a JavaScript Library - Scatter Plot
Tutorial #4 Dive into DC.JS a JavaScript Library - Composite Chart [Left, Right]
Tutorial #3 Dive into DC.JS a JavaScript Library - Line Chart
Tutorial #2 Dive into DC.JS a JavaScript Library - Pie Chart
Tutorial #1 Dive into DC.JS a JavaScript Library - Bar Chart
Posted on Utopian.io - Rewarding Open Source Contributors
@faad, Approve is not my ability, but I can upvote you.
Downvoting a post can decrease pending rewards and make it less visible. Common reasons:
Submit
Thank you for the contribution. It has been approved.
You can contact us on Discord.
[utopian-moderator]
Downvoting a post can decrease pending rewards and make it less visible. Common reasons:
Submit
Hey @faad I am @utopian-io. I have just upvoted you!
Achievements
Suggestions
Get Noticed!
Community-Driven Witness!
I am the first and only Steem Community-Driven Witness. Participate on Discord. Lets GROW TOGETHER!
Up-vote this comment to grow my power and help Open Source contributions like this one. Want to chat? Join me on Discord https://discord.gg/Pc8HG9x
Downvoting a post can decrease pending rewards and make it less visible. Common reasons:
Submit