What Will I Learn?
- Develop a Range Chart using dc.js
Requirements
- Basics of HTML and CSS
- JavaScript Essentials
- Quick Hands on cossfilter.js and d3.js
- Knowledge about statistical data
Difficulty
- Intermediate
Tutorial Contents
- What is Range Chart?
- Create working Environment
- Develop Range Chart
What is Range Chart?
Range chart is a kind of control chart, the chart enable you to monitor variables data when samples are collected at regular intervals from a process. R charts help determine if a process is stable and predictable. The Range Chart consist of pair of charts: One to monitor the process standard deviation and the other to monitor the process mean. Range Chart visualize how the range of the subgroups changes over time.
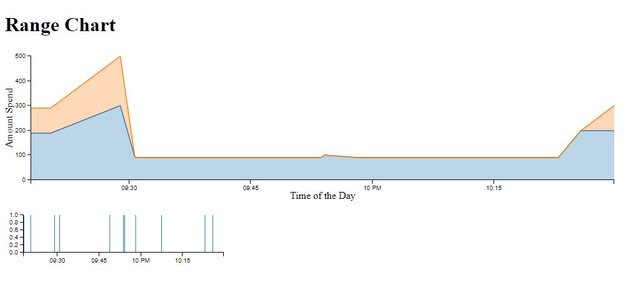
Today, we are going to develop a range chart for our dummy data. At the end of the tutorial we'll have the out as a range chart.

Create working Environment
In order to work with dc.js, we've to create a working environment for dc.js . To do this, first of all open your text editor create a file with name rangeChart.html save it in your working directory.
Now, write the HTML code necessary to work with HTML file. Write this code.
<!DOCTYPE html>
<html lang="EN">
    <head>
      <meta charset="utf-8">
      <title>Range Chart</title>
    </head>
    <body>

    </body>
</html >
Then link the dc.js library with your file and also the other libraries dc.js depends upon, crossfilter.js and d3.js . To do this write this code in you head tag.
      <script type="text/javascript" src="https://cdnjs.cloudflare.com/ajax/libs/d3/3.5.1/d3.min.js"></script>
      <script type="text/javascript" src="https://cdnjs.cloudflare.com/ajax/libs/crossfilter/1.3.12/crossfilter.min.js"></script>
      <script type="text/javascript" src="https://cdnjs.cloudflare.com/ajax/libs/dc/2.1.9/dc.min.js"></script>
      <link rel="stylesheet" type="text/css" href="https://cdnjs.cloudflare.com/ajax/libs/dc/2.1.9/dc.min.css" />
Now, write the code to give heading of the file and also write the code for div in which you want to show your charts. And assign IDs to these div tag. Write this code
        <h1>Range Chart</h1>
        <div id="lineChart"></div>
        <div id="rangeChart"></div>
Now, write the dummy data that'll help us to develop our chart.
        <script type="text/javascript">


          var paymentsRecord = [
          {date: "2011-11-14T16:17:54Z", quantity: 2, total: 190, tip: 100, type: "tab"},
          {date: "2011-11-14T16:20:19Z", quantity: 2, total: 190, tip: 100, type: "tab"},
          {date: "2011-11-14T16:28:54Z", quantity: 1, total: 300, tip: 200, type: "visa"},
          {date: "2011-11-14T16:30:43Z", quantity: 2, total: 90, tip: 0, type: "tab"},
          {date: "2011-11-14T16:48:46Z", quantity: 2, total: 90, tip: 0, type: "tab"},
          {date: "2011-11-14T16:53:41Z", quantity: 2, total: 90, tip: 0, type: "tab"},
          {date: "2011-11-14T16:54:06Z", quantity: 1, total: 100, tip: 0, type: "cash"},
          {date: "2011-11-14T16:58:03Z", quantity: 2, total: 90, tip: 0, type: "tab"},
          {date: "2011-11-14T17:07:21Z", quantity: 2, total: 90, tip: 0, type: "tab"},
          {date: "2011-11-14T17:22:59Z", quantity: 2, total: 90, tip: 0, type: "tab"},
          {date: "2011-11-14T17:25:45Z", quantity: 2, total: 200, tip: 0, type: "cash"},
          {date: "2011-11-14T17:29:52Z", quantity: 1, total: 200, tip: 100, type: "visa"}
        ];
      </script>
You can see the date in our data is in string, change the date to date object that we can use it in our graph. To do this write the code.
        paymentsRecord.forEach(function(d){
            //console.log(typeof(d.date)); //check the type before it changes
            var orgDate = new Date(d.date); // changes the string date into origional date type
            d.date = orgDate; // Overwrite the String date with Original date type
            console.log(typeof(d.date)); //check the type after make change, you can see it converts into date object
        });
Develop Range Chart
Once we created our working environment, now we'll move toward our range chart. First of all feed our dummy data to the crossfilter.js which allow us to create dimension and grouped the data. To feed data to crossfilter write this code.
var facts = crossfilter(paymentsRecord);
Now create dimension and then grouped our data.
// For Range Chart
          var dimensionByDate = facts.dimension(function(d){ return d.date;});
          var groupByDate = dimensionByDate.group();

// For Line Chart ,   the dimension will the same for both.
          var groupByTotal = dimensionByDate.group().reduceSum(function(d){ return d.total});
          var groupByTip = dimensionByDate.group().reduceSum(function(d){ return d.tip});
Now, pick the starting and ending time for the transactions, later we'll use it to set the range for x-axis.
          var minDate = dimensionByDate.bottom(1)[0].date;
          var maxDate = dimensionByDate.top(1)[0].date;
Now its time to create our chart, as we mentioned above range chart comes in pair charts. So, first we create our main chart. Our main chart is a line chart, so create an line chart. To do this create an object of lineChart class and pass it the id of the div that we create above for line chart. Also set its width and height.
          var lineChart = dc.lineChart('#lineChart')
                    .width(1024) // width of the chart
                    .height(250) // height of the chart
Now pass it the dimension and group we created above and use .stack([]) method to add the chart for our tips data. And also write the other necessary methods for lineChart.
var lineChart = dc.lineChart('#lineChart')
                    .width(1024) // width of the chart
                    .height(250) // height of the chart
                    //.rangeChart(rangeChart)
                    .renderArea(true)
                    .mouseZoomable(true)
                    .brushOn(false)
                    .dimension(dimensionByDate) // dimention we create before passed as parameter
                    .group(groupByTotal, "Total Payment")
                    .stack(groupByTip,"tip")
                    .xAxisLabel(["Time of the Day"]) // Lebelling the X Axis
                    .yAxisLabel("Amount Spend") // // Lebelling the X Axis
                    .x(d3.time.scale().domain([minDate,maxDate])) //// created x-axis scales
            lineChart.yAxis().ticks(5);
            lineChart.xAxis().ticks(4);
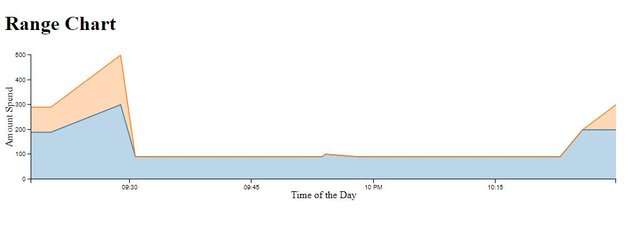
Here you can see we also use a method .rangeChart(rangeChart) and pass it and rangeChart, this argument is the object of our rangeChart that we'll create in just few moments below. For now we comment this out that we can see the out put for our range chart.
Output:

Now write the code for the our range chart. To do this create and object of the rangeChart and pass it the ID of the div that we created above for the range chart. Also set its width and height.
          var rangeChart = dc.barChart("#rangeChart")
                    .width(400)
                    .height(100)
Now pass the dimension and group of data that we created for our range Chart.
                    .dimension(dimensionByDate)
                    .group(groupByDate)
Now set the scale for the x-axis.
.x(d3.time.scale().domain([minDate,maxDate]));
Also set the total number of ticks for our x-axis and y-axis.
            rangeChart.yAxis().ticks(5);
            rangeChart.xAxis().ticks(4);
Now, at the end render the chart.
dc.renderAll();
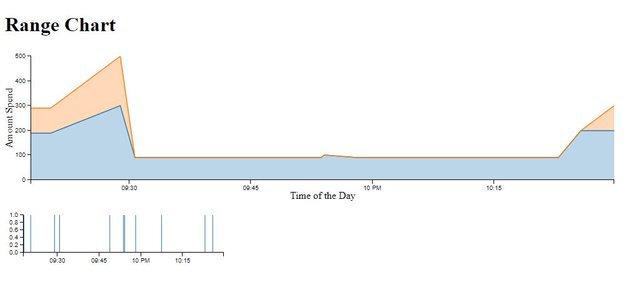
To see the out put remove the comment from .rangeChart([]) method form our line Chart code.
output:

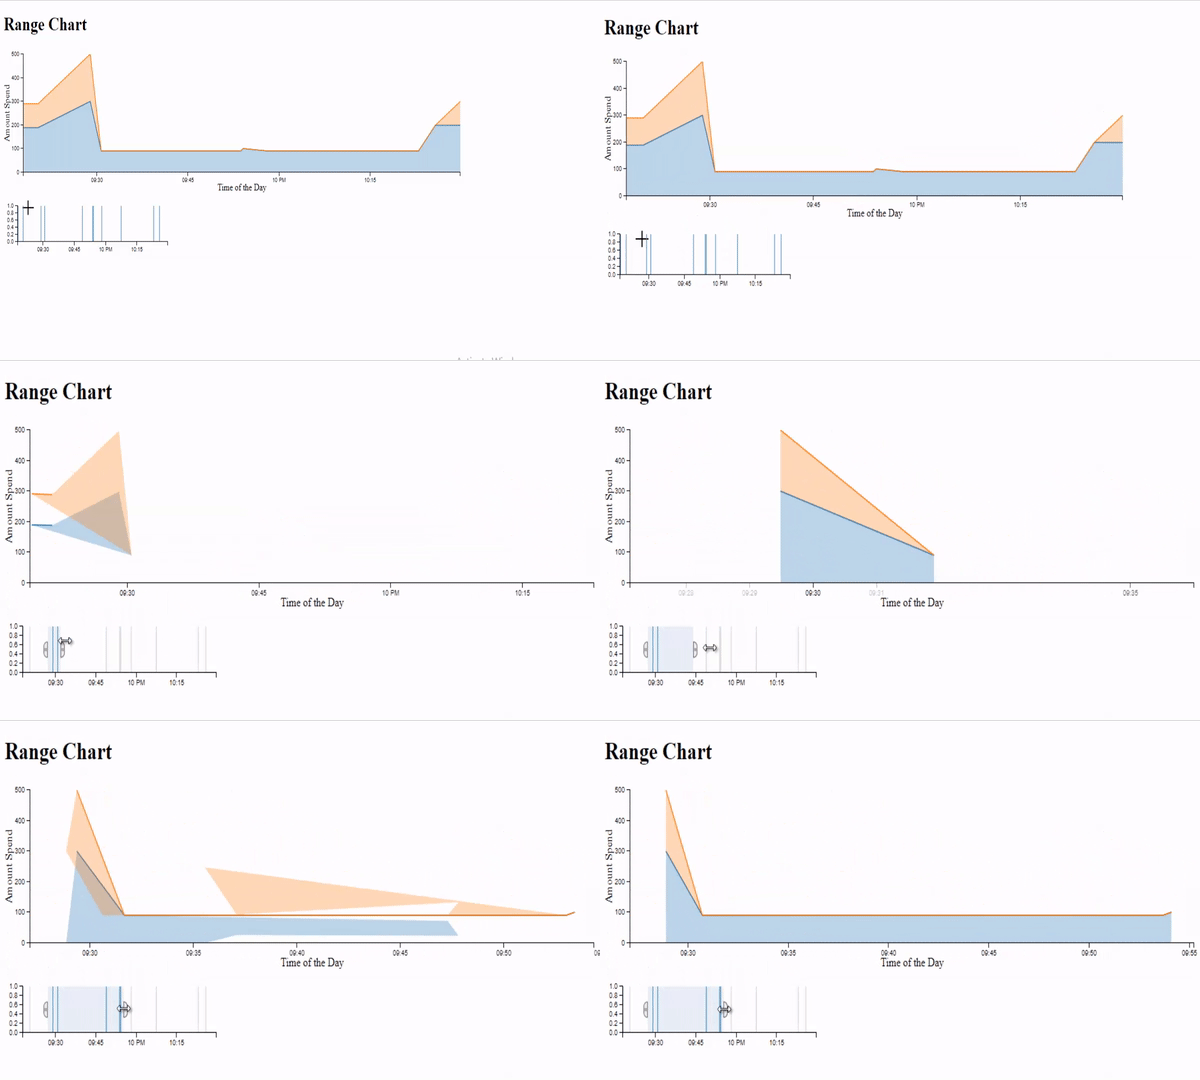
To see its working we also uploaded below a .gif image see how rangeChart filters the data.
Output:

Source Code:
<!DOCTYPE html>
<html lang="EN">
    <head>
      <meta charset="utf-8">
      <title>Range Chart</title>
      <script type="text/javascript" src="https://cdnjs.cloudflare.com/ajax/libs/d3/3.5.1/d3.min.js"></script>
      <script type="text/javascript" src="https://cdnjs.cloudflare.com/ajax/libs/crossfilter/1.3.12/crossfilter.min.js"></script>
      <script type="text/javascript" src="https://cdnjs.cloudflare.com/ajax/libs/dc/2.1.9/dc.min.js"></script>
      <link rel="stylesheet" type="text/css" href="https://cdnjs.cloudflare.com/ajax/libs/dc/2.1.9/dc.min.css" />


    </head>
    <body>
        <h1>Range Chart</h1>
        <div id="lineChart"></div>
        <div id="rangeChart"></div>

        <script type="text/javascript">


          var paymentsRecord = [
          {date: "2011-11-14T16:17:54Z", quantity: 2, total: 190, tip: 100, type: "tab"},
          {date: "2011-11-14T16:20:19Z", quantity: 2, total: 190, tip: 100, type: "tab"},
          {date: "2011-11-14T16:28:54Z", quantity: 1, total: 300, tip: 200, type: "visa"},
          {date: "2011-11-14T16:30:43Z", quantity: 2, total: 90, tip: 0, type: "tab"},
          {date: "2011-11-14T16:48:46Z", quantity: 2, total: 90, tip: 0, type: "tab"},
          {date: "2011-11-14T16:53:41Z", quantity: 2, total: 90, tip: 0, type: "tab"},
          {date: "2011-11-14T16:54:06Z", quantity: 1, total: 100, tip: 0, type: "cash"},
          {date: "2011-11-14T16:58:03Z", quantity: 2, total: 90, tip: 0, type: "tab"},
          {date: "2011-11-14T17:07:21Z", quantity: 2, total: 90, tip: 0, type: "tab"},
          {date: "2011-11-14T17:22:59Z", quantity: 2, total: 90, tip: 0, type: "tab"},
          {date: "2011-11-14T17:25:45Z", quantity: 2, total: 200, tip: 0, type: "cash"},
          {date: "2011-11-14T17:29:52Z", quantity: 1, total: 200, tip: 100, type: "visa"}
        ];

        paymentsRecord.forEach(function(d){
            //console.log(typeof(d.date)); //check the type before it changes
            var orgDate = new Date(d.date); // changes the string date into origional date type
            d.date = orgDate; // Overwrite the String date with Original date type
            console.log(typeof(d.date)); //check the type after make change, you can see it converts into date object
        });

          var facts = crossfilter(paymentsRecord);


          var dimensionByDate = facts.dimension(function(d){ return d.date;});
          var groupByDate = dimensionByDate.group();

          var groupByTotal = dimensionByDate.group().reduceSum(function(d){ return d.total});
          var groupByTip = dimensionByDate.group().reduceSum(function(d){ return d.tip});

          var minDate = dimensionByDate.bottom(1)[0].date;
          var maxDate = dimensionByDate.top(1)[0].date;


          var rangeChart = dc.barChart("#rangeChart")
                    .width(400)
                    .height(100)
                    .dimension(dimensionByDate)
                    .group(groupByDate)
                    .x(d3.time.scale().domain([minDate,maxDate]));
            rangeChart.yAxis().ticks(5);
            rangeChart.xAxis().ticks(4);

          var lineChart = dc.lineChart('#lineChart')
                    .width(1024) // width of the chart
                    .height(250) // height of the chart
                    .rangeChart(rangeChart)
                    .renderArea(true)
                    .mouseZoomable(true)
                    .brushOn(false)
                    .dimension(dimensionByDate) // dimention we create before passed as parameter
                    .group(groupByTotal, "Total Payment") // group we created before passed as parameter to barChart method
                    .stack(groupByTip,"tip")
                    .xAxisLabel(["Time of the Day"]) // Lebelling the X Axis
                    .yAxisLabel("Amount Spend") // // Lebelling the X Axis
                    .x(d3.time.scale().domain([minDate,maxDate])) //// created x-axis scales
            lineChart.yAxis().ticks(5);
            lineChart.xAxis().ticks(4);

          dc.renderAll();

      </script>

  </body>
</html>
Curriculum
Tutorial #14 Dive into DC.JS a JavaScript Library - Row Chart
Tutorial #13 Dive into DC.JS a JavaScript Library - Data Table Pagination
Tutorial #12 Dive into DC.JS a JavaScript Library - Heat Map Chart
Tutorial #11 Dive into DC.JS a JavaScript Library - Geo Choropleth Chart
Tutorial #10 Dive into DC.JS a JavaScript Library - Box Plot
Tutorial #9 Dive into DC.JS a JavaScript Library - Series Chart
Tutorial #8 Dive into DC.JS a JavaScript Library - Bubble Chart
Tutorial #7 Dive into DC.JS a JavaScript Library - Data Table
Tutorial #6 Dive into DC.JS a JavaScript Library - Stacked Bar Chart
Tutorial #5 Dive into DC.JS a JavaScript Library - Scatter Plot
Tutorial #4 Dive into DC.JS a JavaScript Library - Composite Chart [Left, Right]
Tutorial #3 Dive into DC.JS a JavaScript Library - Line Chart
Tutorial #2 Dive into DC.JS a JavaScript Library - Pie Chart
Tutorial #1 Dive into DC.JS a JavaScript Library - Bar Chart
Posted on Utopian.io - Rewarding Open Source Contributors
Thank you for the contribution. It has been approved.
You can contact us on Discord.
[utopian-moderator]
Downvoting a post can decrease pending rewards and make it less visible. Common reasons:
Submit
Hey @cha0s0000, I just gave you a tip for your hard work on moderation. Upvote this comment to support the utopian moderators and increase your future rewards!
Downvoting a post can decrease pending rewards and make it less visible. Common reasons:
Submit
Hey @faad I am @utopian-io. I have just upvoted you!
Achievements
Community-Driven Witness!
I am the first and only Steem Community-Driven Witness. Participate on Discord. Lets GROW TOGETHER!
Up-vote this comment to grow my power and help Open Source contributions like this one. Want to chat? Join me on Discord https://discord.gg/Pc8HG9x
Downvoting a post can decrease pending rewards and make it less visible. Common reasons:
Submit