What Will I Learn?
By Continuing our DC.JS tutorial series, today we'll build pie chart using dc.js library.
- Build Pie Chart
- Example Code
Requirements
- Basics of programming
- Basics of HTML & CSS
- Intermediate level JavaScript
Difficulty
- Intermediate
Tutorial Contents
- What is Pie Chart
- Build Environment for
dc.js - Build Pie Chart
What is Pie Chart
A pie chart also known as circle chart, is a circular statistical graph which is divided into slices to illustrate numerical proportion. While it is named for its resemblance to a pie which has been sliced, there are variations on the way it can be presented. The arc length of the each slice depends on the amount it present out of total. The earliest known pie chart is generally credited to William Playfair's Statistical Breviary of 1801.
Pie charts are very widely used in every field. However, many experts didn't recommend it use, pointing out that research has shown it is difficult to compare data across different pie charts. Pie charts can be replaced in most cases by other charts such as Bar Chart, Line Chart, Bubble Char and others.
Build Environment for dc.js
To use dc.js its necessary to build an environment for the this library, for this first create a HTML file with name pieChart.html and save it. Write the basic HTML code
<html lang="EN">
    <head>
      <meta charset="utf-8">
      <title>Pie Chart</title>
    </head>
    <body>
        <h1>Pie Chart Total Payment By Type</h1>
        <div id="pieChart"></div>
</body>
</html>
Then link the file you dc.js library and the other two libraries it upon, crossfilter.js and d3.js. In our previous tutorial we've talked about these libraries you can check out. Here we link these files by CDN.
<script type="text/javascript" src="https://cdnjs.cloudflare.com/ajax/libs/d3/3.5.1/d3.min.js"></script>
      <script type="text/javascript" src="https://cdnjs.cloudflare.com/ajax/libs/crossfilter/1.3.12/crossfilter.min.js"></script>
      <script type="text/javascript" src="https://cdnjs.cloudflare.com/ajax/libs/dc/2.1.9/dc.min.js"></script>
      <link rel="stylesheet" type="text/css" href="https://cdnjs.cloudflare.com/ajax/libs/dc/2.1.9/dc.min.css" />
You can link these files locally by installing it in your computer (see tutorial #1).
Build Pie Chart
Simple Pie Chart
Once you setup your environment, lets start to build our pie chart, First of all take the raw data in JSON format for which we want to build a pie chart. You can use your own data for working
<script type="text/javascript">


          var paymentsRecord = [
          {date: "2011-11-14T16:17:54Z", quantity: 2, total: 190, tip: 100, type: "tab"},
          {date: "2011-11-14T16:20:19Z", quantity: 2, total: 190, tip: 100, type: "tab"},
          {date: "2011-11-14T16:28:54Z", quantity: 1, total: 300, tip: 200, type: "visa"},
          {date: "2011-11-14T16:30:43Z", quantity: 2, total: 90, tip: 0, type: "tab"},
          {date: "2011-11-14T16:48:46Z", quantity: 2, total: 90, tip: 0, type: "tab"},
          {date: "2011-11-14T16:53:41Z", quantity: 2, total: 90, tip: 0, type: "tab"},
          {date: "2011-11-14T16:54:06Z", quantity: 1, total: 100, tip: 0, type: "cash"},
          {date: "2011-11-14T16:58:03Z", quantity: 2, total: 90, tip: 0, type: "tab"},
          {date: "2011-11-14T17:07:21Z", quantity: 2, total: 90, tip: 0, type: "tab"},
          {date: "2011-11-14T17:22:59Z", quantity: 2, total: 90, tip: 0, type: "tab"},
          {date: "2011-11-14T17:25:45Z", quantity: 2, total: 200, tip: 0, type: "cash"},
          {date: "2011-11-14T17:29:52Z", quantity: 1, total: 200, tip: 100, type: "visa"}
        ];
        </script>
Now pass this raw data to crossfilter
var facts = crossfilter(paymentsRecord);
After this create the dimension and then grouped this data, write this code.
          var dimensionByType = facts.dimension(function(d){ return d.type; }); //dimension
          var groupByType = dimensionByType.group().reduceSum(function(d){ return d.total; }); // group data total payment by type
Now, its time to build your Pie Chart, call the pieChart("#pieChart") method of dc object, here #piedChart is the id of the div we defined above .
var barChart = dc.pieChart('#pieChart')
After this define the width, height, radius, dimension and group of the pie chart. At the end render it
var barChart = dc.pieChart('#pieChart')
                .width(1024) // width of the chart
                .height(250) // height of the chart
                .radius(150) // radius of the circle
                .dimension(dimensionByType) // dimention, argument which we defined above
                .group(groupByType) //group , argument which we defined above
dc.renderAll();
Output
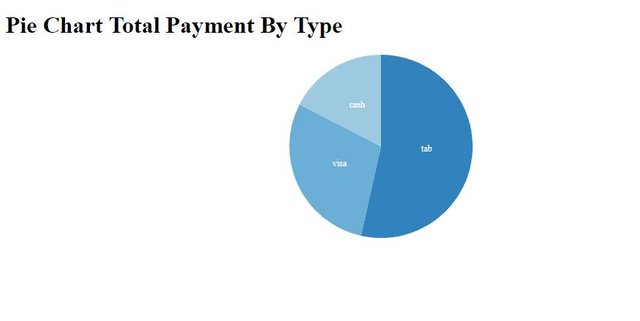
Now, its time to make our Pie Chart interesting
If you want to create the inner circle in our pie chart then write this code .innerRadius(60)
Output
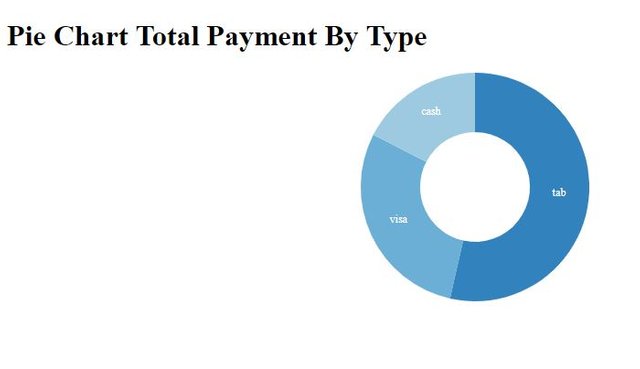
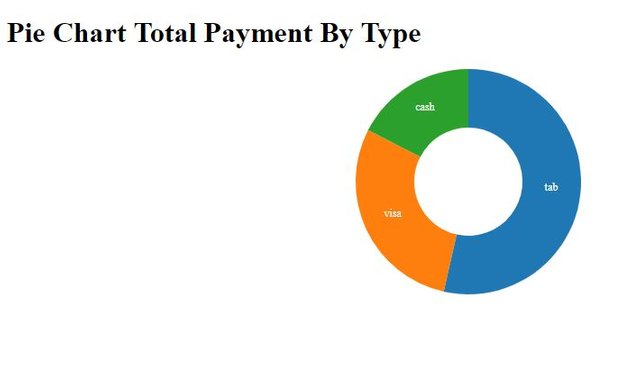
Some interesting colors for the Pie Chart Sections
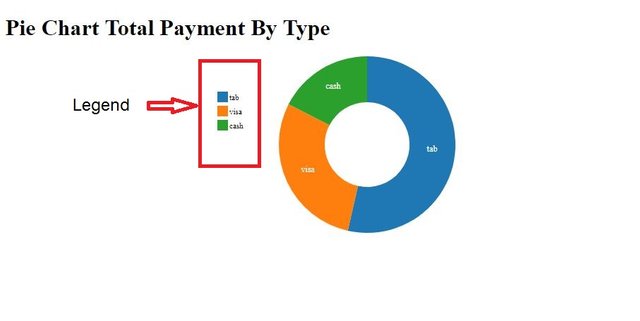
Define the legend with description for the pie chart .legend(dc.legend())
If you want to move the legend near or far from the the graph then .legend(dc.legend().x(300).y(50).itemHeight(15).gap(5))
.x()move horizontally.y()move verticallyitemHeight(15)size of the legendgap()the gap between the legend
output
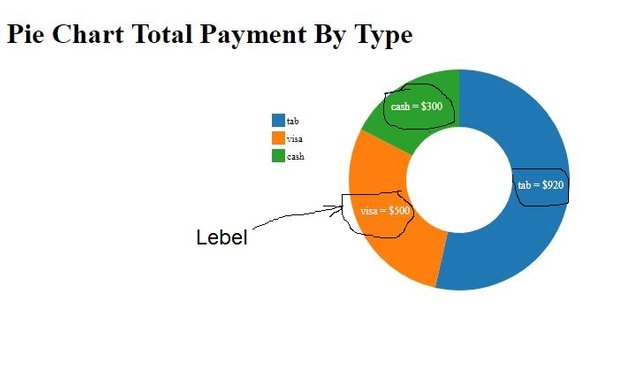
To give title and label to our graph, label is text show when your hover on the each section of the pie graph and label the text you can see on the withing the each section of the chart. for this add this code to your existing code.
              .title(function(d){ return d.key + ': $'+d.value; })
                .label(function(d){ return d.key + ' = $'+d.value; })
                .renderLabel(true)
output
To move your graph on the screen where ever you want use these methods
.cx([700]) // move along x-axis
.cy([125]) // move along y-axis
Use .transitionDuration(2000) method to load your graph within the given time, you'll see how smoothly it'll loaded.
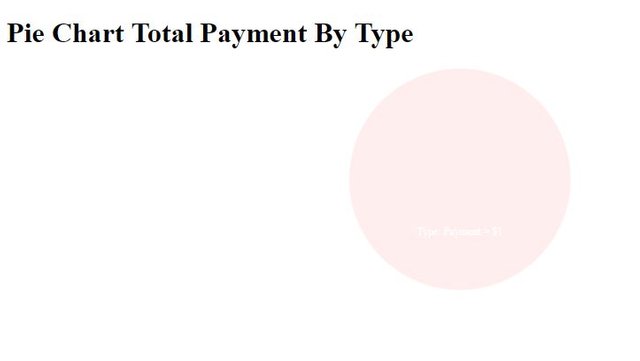
Here is one interesting method .emptyTitle(["Type: Payment"]) When there is no data the default title of the pie graph. Here is remove JSON data and this method see the results
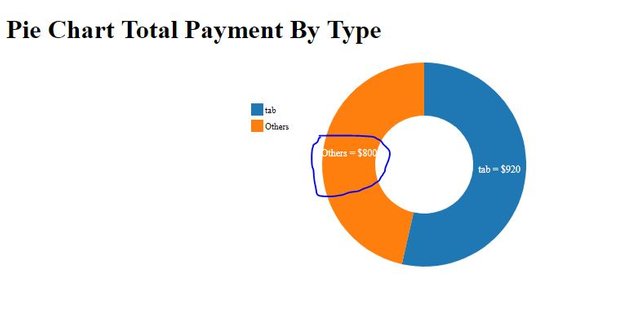
If you don't want your graph portioned into many slices then you can fix the max slice number and the remaining slices sum up into one single slice. Here in our above example there are 3 slices. Apply method to single slice.
.slicesCap([1]) // max number of slices
You'll see the other 2 slices sum up into single slice which name as "others"
Pie Chart with external labels
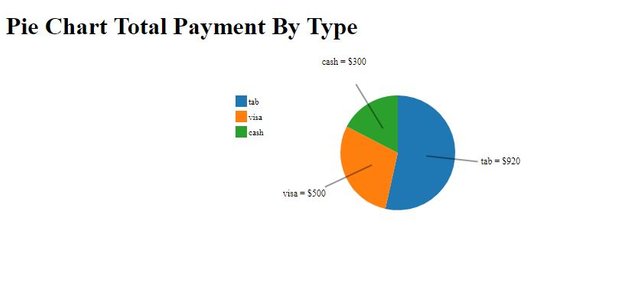
Pie Chat with external labels, its the labeled chart with lines. To make this chart you just have to add these 3 methods to your simple pie chart code(above example).
                .drawPaths(true) //draw the label lines
                .externalLabels(60)
                .externalRadiusPadding(50)
output
Demo [whole code]
My Previous Contribution
Posted on Utopian.io - Rewarding Open Source Contributors
Thank you for the contribution. It has been approved.
You can contact us on Discord.
[utopian-moderator]
Downvoting a post can decrease pending rewards and make it less visible. Common reasons:
Submit
@zonguin this has been kept approved, but please check my note below to the author
Downvoting a post can decrease pending rewards and make it less visible. Common reasons:
Submit
Ok thanks
Downvoting a post can decrease pending rewards and make it less visible. Common reasons:
Submit
Hey @faad I am @utopian-io. I have just upvoted you!
Achievements
Suggestions
Get Noticed!
Community-Driven Witness!
I am the first and only Steem Community-Driven Witness. Participate on Discord. Lets GROW TOGETHER!
Up-vote this comment to grow my power and help Open Source contributions like this one. Want to chat? Join me on Discord https://discord.gg/Pc8HG9x
Downvoting a post can decrease pending rewards and make it less visible. Common reasons:
Submit
Please make sure that if you copy sample data from a source, to mention that you did so, for example in this case you got the sample dates from the DC API documentation. While we approved your work this time, please make sure to avoid such occurrences in the future.
Downvoting a post can decrease pending rewards and make it less visible. Common reasons:
Submit