What Will I Learn?
- Line Chart in dc.js
- Ordinal Line Chart
- Area Chart
Requirements
Write here a bullet list of the requirements for the user in order to follow this tutorial.
- Our Previous dc.js tutorials
- Basics of HTML and CSS
- Intermediate level JavaScript
- Statistical Data
Difficulty
Either choose between the following options:
- Intermediate
Tutorial Contents
- Line Chart
- Build Environment
- Build Line Chart
- Simple Line Chart
- Ordinal Line Chart
- Area Char
Line Chart
A line chart or line graph is a type of chart which displays information as a series of data points called 'markers' connected by straight line segments. A line chart is often used to visualize a the data over time intervals, thus the line is often drawn chronologically. It is also called run charts. It is a very basic type of graph commonly used in every business field.
Build Environment
If you see our previous tutorials, then you know that how to set the development environment for dc.js . If not then first see our tutorial #1, at the end of the tutorial you can find out the link. So, here we are directly share the code
<!DOCTYPE html>
<html lang="EN">
    <head>
      <meta charset="utf-8">
      <title>Line Chart</title>
      <script type="text/javascript" src="https://cdnjs.cloudflare.com/ajax/libs/d3/3.5.1/d3.min.js"></script>
      <script type="text/javascript" src="https://cdnjs.cloudflare.com/ajax/libs/crossfilter/1.3.12/crossfilter.min.js"></script>
      <script type="text/javascript" src="https://cdnjs.cloudflare.com/ajax/libs/dc/2.1.9/dc.min.js"></script>
      <link rel="stylesheet" type="text/css" href="https://cdnjs.cloudflare.com/ajax/libs/dc/2.1.9/dc.min.css" />
    </head>
    <body>
        <h1>Line Chart Payment Over Time</h1>
        <div id="lineChart" style="margin:0 0 0 30px"></div>

        <script type="text/javascript">


          var paymentsRecord = [
          {date: "2011-11-14T16:17:54Z", quantity: 2, total: 190, tip: 100, type: "tab"},
          {date: "2011-11-14T16:20:19Z", quantity: 2, total: 190, tip: 100, type: "tab"},
          {date: "2011-11-14T16:28:54Z", quantity: 1, total: 300, tip: 200, type: "visa"},
          {date: "2011-11-14T16:30:43Z", quantity: 2, total: 90, tip: 0, type: "tab"},
          {date: "2011-11-14T16:48:46Z", quantity: 2, total: 90, tip: 0, type: "tab"},
          {date: "2011-11-14T16:53:41Z", quantity: 2, total: 90, tip: 0, type: "tab"},
          {date: "2011-11-14T16:54:06Z", quantity: 1, total: 100, tip: 0, type: "cash"},
          {date: "2011-11-14T16:58:03Z", quantity: 2, total: 90, tip: 0, type: "tab"},
          {date: "2011-11-14T17:07:21Z", quantity: 2, total: 90, tip: 0, type: "tab"},
          {date: "2011-11-14T17:22:59Z", quantity: 2, total: 90, tip: 0, type: "tab"},
          {date: "2011-11-14T17:25:45Z", quantity: 2, total: 200, tip: 0, type: "cash"},
          {date: "2011-11-14T17:29:52Z", quantity: 1, total: 200, tip: 100, type: "visa"}
        ];

        </script>

    </body>
</html>
Here I also include the JSON data that we are using in our previous tutorials.
Build Line Chart
Once you set up the development environment, we'll start here to develop our Line Chart. As we mentioned above the line chart visualize the data over time. So, today here we develop our "Line Chart - Payment over Time".
Simple Line Chart
In first step we'll have to feed the data to crossfilter.js library as we done in our previous tutorials.
var facts = crossfilter(paymentsRecord);
Then create the dimension of the data, as we mentioned above our chart will be "data over time". So according to our data we'll have to create the dimension of date. For this write the code
var dimensionByDate = facts.dimension(function (d){ return d.date;});
But here is one problem with our data, our "date" portion in our json data is in "string" type, it'll not works properly with our graph. So, before we create date dimension we'll have to replace string data into date object data. There are many other ways to do this, but we find this one best, write this code just under the json data.
//  paymentsRecord is the variable in which we store our json data
paymentsRecord.forEach(function(d){
            //console.log(typeof(d.date)); //check the type before it changes
            var orgDate = new Date(d.date); // changes the string date into origional date type
            d.date = orgDate; // Overwrite the String date with Original date type
            //console.log(typeof(d.date)); //check the type after make change, you can see it converts into date object
        });
Now you are able to create dimension, place the above dimension code under it.
After creating dimension we'll have to grouped our data over time. So write the code
var groupByDate = dimensionByDate.group().reduceSum(function(d){ return d.total; });
Once you done with crossfilter work, Its time to move to our Line Chart. Create the object of the line chart from dc class. Also set its width, height, dimension and group.
var lineChart = dc.lineChart('#lineChart')
                    .width(1024) // width of the chart
                    .height(250) // height of the chart
                    .xAxisLabel(["Time of the Day"]) // Lebelling the X Axis
                    .yAxisLabel("Amount Spend") // // Lebelling the X Axis
                    .brushOn(false)
                    .dimension(dimensionByDate) // dimention we create before passed as parameter
                    .group(groupByDate) // group we created before passed as parameter to barChart method
Here one more thing we'll have to do, we have to set the x-axis scale to the time mentioned in the data . For this dc.js gives us a method x() which takes the d3.time.scale().domain([min,max]) as an argument. Here min and the max are the variable, minvalue the start value on the x-axis and maxvalue end value on x-axis.
As you know our x-axis are the time interval, we'll have to generate our minDate and the maxDate value from our data for this write the
          var minDate = dimensionByDate.bottom(1)[0].date;
          var maxDate = dimensionByDate.top(1)[0].date;
bottom() and top() methods in crossfilter.js library
top() => returned array is sorted by descending natural order. top(3) the top 3 records descending order.
top(1)[0] returns the biggest number in the list
bottom() => returned array is sorted by ascending natural order. bottom(3) the top 3 records of the ascending order.
bottom(1)[0] returns the smallest number in the list.
For more details you can checkout the crossfilter.js documentation.
So, above we get the starting and ending time from our data, now we have to put thees two variable in the place of min and max of this function [ d3.time.scale().domain([min,max])]. our code will be
.x(d3.time.scale().domain([minDate,maxDate])); // created x-axis scales
At the end, render our line chart.
dc.renderAll();
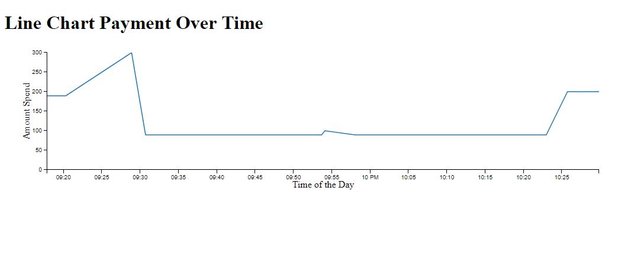
output

Here you can see in the output the x-axis scale are to many not looking clean, you can adjust the x-axis and y-axis according to your need just write these two methods in your code
             lineChart.yAxis().ticks(5);
            lineChart.xAxis().ticks(4);
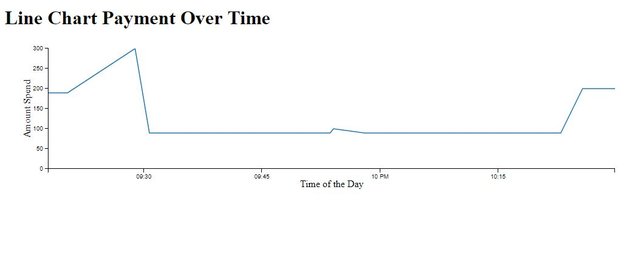
output:

You can see we limit the x-axis scales to 4.
Area Chart
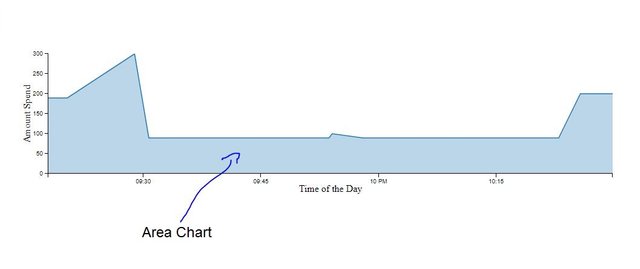
To create an area chart you just have to add a single method to our above simple line chart code.
.renderArea(true) // chart will render the area beneath each line and the line chart turns into an area chart.
output:

Ordinal Line Chart
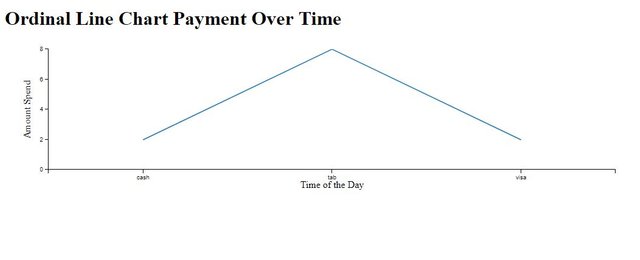
As we've explained in our tutorial #1 what is an ordinal chart, today our tutorial is about line chart. so, here we'll create an ordinal line chart. The basic code will be the same , write code for ordinal line chart, nothing is new, so, didn't require any explanation.
<script type="text/javascript">


          var paymentsRecord = [
          {date: "2011-11-14T16:17:54Z", quantity: 2, total: 190, tip: 100, type: "tab"},
          {date: "2011-11-14T16:20:19Z", quantity: 2, total: 190, tip: 100, type: "tab"},
          {date: "2011-11-14T16:28:54Z", quantity: 1, total: 300, tip: 200, type: "visa"},
          {date: "2011-11-14T16:30:43Z", quantity: 2, total: 90, tip: 0, type: "tab"},
          {date: "2011-11-14T16:48:46Z", quantity: 2, total: 90, tip: 0, type: "tab"},
          {date: "2011-11-14T16:53:41Z", quantity: 2, total: 90, tip: 0, type: "tab"},
          {date: "2011-11-14T16:54:06Z", quantity: 1, total: 100, tip: 0, type: "cash"},
          {date: "2011-11-14T16:58:03Z", quantity: 2, total: 90, tip: 0, type: "tab"},
          {date: "2011-11-14T17:07:21Z", quantity: 2, total: 90, tip: 0, type: "tab"},
          {date: "2011-11-14T17:22:59Z", quantity: 2, total: 90, tip: 0, type: "tab"},
          {date: "2011-11-14T17:25:45Z", quantity: 2, total: 200, tip: 0, type: "cash"},
          {date: "2011-11-14T17:29:52Z", quantity: 1, total: 200, tip: 100, type: "visa"}
        ];

          var facts = crossfilter(paymentsRecord);

          var dimensionByType = facts.dimension(function (d){ return d.type;});
          var groupByType = dimensionByType.group().reduceCount(function(d){ return d.type; });

          var lineChart = dc.lineChart('#lineChart')
                    .width(1024) // width of the chart
                    .height(250) // height of the chart
                    //.renderArea(true)
                    .xAxisLabel(["Time of the Day"]) // Lebelling the X Axis
                    .yAxisLabel("Amount Spend") // // Lebelling the X Axis
                    .brushOn(false)
                    .dimension(dimensionByType) // dimention we create before passed as parameter
                    .group(groupByType) // group we created before passed as parameter to barChart method
                    .x(d3.scale.ordinal()) //// created x-axis scales
                    .xUnits(dc.units.ordinal)
            lineChart.yAxis().ticks(5);
            lineChart.xAxis().ticks(4);

            dc.renderAll();

        </script>
Output:

Curriculum
- Tutorial #1 Dive into DC.JS a JavaScript Library - Bar Chart
- Tutorial #2 Dive into DC.JS a JavaScript Library - Pie Chart
Posted on Utopian.io - Rewarding Open Source Contributors
Thank you for the contribution. It has been approved.
You can contact us on Discord.
[utopian-moderator]
Downvoting a post can decrease pending rewards and make it less visible. Common reasons:
Submit
Hey @faad I am @utopian-io. I have just upvoted you!
Achievements
Suggestions
Get Noticed!
Community-Driven Witness!
I am the first and only Steem Community-Driven Witness. Participate on Discord. Lets GROW TOGETHER!
Up-vote this comment to grow my power and help Open Source contributions like this one. Want to chat? Join me on Discord https://discord.gg/Pc8HG9x
Downvoting a post can decrease pending rewards and make it less visible. Common reasons:
Submit