What Will I Learn?
- Composite Chart
- Right Axis Chart
Requirements
- Our previous dc.js tutorials
- Basics of HTML & CSS
- Intermediate Level JavaScript
- Statistical Data
Difficulty
- Intermediate
Tutorial Contents
- Introduction
- Build Working Environment
- Build Composite Chart [Left, Right]
Introduction
Today in this tutorial we'll develop a composite line chart, our y-axis will be both left and right. Here both charts will be the line chart, but you can develop differ one is line chart and other bar chart and so on. In this tutorial as we are going to use the use some code form our previous tutorials parts. So if you aren't familiar with our previous tutorials or haven't work on dc.js before then it is important for you to learn our previous tutorial to continue with this tutorial. Otherwise you'll not be able to understand this tutorial. If you are good at then continue with us.
Build Working Environment
As mentioned above here for building working environment we'll use the same json data example used in our other tutorials, So the basic environment will be the same but with little changes to it [title of the page, id of the div, dimension and grouped data].
<!DOCTYPE html>
<html lang="EN">
    <head>
      <meta charset="utf-8">
      <title>Right Aixis Chart</title>
      <script type="text/javascript" src="https://cdnjs.cloudflare.com/ajax/libs/d3/3.5.1/d3.min.js"></script>
      <script type="text/javascript" src="https://cdnjs.cloudflare.com/ajax/libs/crossfilter/1.3.12/crossfilter.min.js"></script>
      <script type="text/javascript" src="https://cdnjs.cloudflare.com/ajax/libs/dc/2.1.9/dc.min.js"></script>
      <link rel="stylesheet" type="text/css" href="https://cdnjs.cloudflare.com/ajax/libs/dc/2.1.9/dc.min.css" />
    </head>
    <body>
        <h1>Composite Chart</h1>
        <div id="compositeChart" style="margin:0 0 0 30px;"></div>

        <script type="text/javascript">


          var paymentsRecord = [
          {date: "2011-11-14T16:17:54Z", quantity: 2, total: 190, tip: 100, type: "tab"},
          {date: "2011-11-14T16:20:19Z", quantity: 2, total: 190, tip: 100, type: "tab"},
          {date: "2011-11-14T16:28:54Z", quantity: 1, total: 300, tip: 200, type: "visa"},
          {date: "2011-11-14T16:30:43Z", quantity: 2, total: 90, tip: 50, type: "tab"},
          {date: "2011-11-14T16:48:46Z", quantity: 2, total: 90, tip: 70, type: "tab"},
          {date: "2011-11-14T16:53:41Z", quantity: 2, total: 90, tip: 0, type: "tab"},
          {date: "2011-11-14T16:54:06Z", quantity: 1, total: 100, tip: 40, type: "cash"},
          {date: "2011-11-14T16:58:03Z", quantity: 2, total: 90, tip: 90, type: "tab"},
          {date: "2011-11-14T17:07:21Z", quantity: 2, total: 90, tip: 0, type: "tab"},
          {date: "2011-11-14T17:22:59Z", quantity: 2, total: 90, tip: 30, type: "tab"},
          {date: "2011-11-14T17:25:45Z", quantity: 2, total: 200, tip: 0, type: "cash"},
          {date: "2011-11-14T17:29:52Z", quantity: 1, total: 200, tip: 100, type: "visa"}
        ];

        paymentsRecord.forEach(function(d){
            //console.log(typeof(d.date)); //check the type before it changes
            var orgDate = new Date(d.date); // changes the string date into original date type
            d.date = orgDate; // Overwrite the String date with Original date type
            //console.log(typeof(d.date)); //check the type after make change, you can see it converts into date object
        });

          var facts = crossfilter(paymentsRecord);

          var dimensionByDate = facts.dimension(function (d){ return d.date;});
          var groupByDate = dimensionByDate.group().reduceSum(function(d){ return d.total; });
          var groupByTip = dimensionByDate.group().reduceSum(function(d){ return d.tip; });

          var minDate = dimensionByDate.bottom(1)[0].date;
          var maxDate = dimensionByDate.top(1)[0].date;


        </script>

    </body>
</html>
Here in the above code we uses the dimension and group of our tutorial #3 Simple Line Chart, and how to change the string date into the object date, then we get the start date/time and end date/time form our data and stored it in minDate and maxDate that later used in developing x-axis scales(if you didn't get this then please see our tutorial #3). Here in above code I added one extra thing I grouped the data two times, one payment over time and other one is Tip over time. First I've explained and the 2nd is for the right-axis. Here in our graph on left-axis there will be **payment **and on right-axis Tips
So, Let's move to our Composite Chart.
- Build Composite Chart [Left, Right]
Above we've created our working environment , so move to our composite chart. To create a composite chart there is a compositeChart class in ``` dc.js ``. Create an object of this class as we created for bar chart, pie chart or for line chart. Also set the with, height and dimension but not the group we will define it later.
var moveChart = dc.compositeChart('#compositeChart')
                    .width(1024) // width of the chart
                    .height(350) // height of the chart
                    .xAxisLabel(["Time of the Day"]) // Label the x-axis
                    .yAxisLabel("Amount Spend") // Left y-axis label
                    .rightYAxisLabel("Tip") // Right y-axis label
                    .dimension(dimensionByDate)
                    .brushOn(false)
One thing you'll have to remember the dimension (x-axis) will the same for both groups (y-axis). So don't confuse here. Here we also an extra method brushOn(ture) we'll explain it later. First we'll complete our Chart.
Here is the real work, dc.js provide us a method of compositeChart class .compose([])
it takes an array of the different chart objects and their relevant groups and build provided charts for us. In chart objects we pass an argument of the object of compositeChart class that we created above. compositeChart also called the parent chart. Here follow we give general example.
.compose([

             dc.lineChart("moveChart")
                                 .group(groupByDate),
             dc.lineChart("moveChart")
                                 .group(groupByDate), .......
                                        .....................
])
You can add as many graphs as you want and do separate them from each other by comma. Graph object comma, 2nd graph object comma, 3rd graph object comma and so on.
So, Lets's implement it in our example code. Here we only develop two graphs for left-axis and right-axis. First we develop left-axis to make it easier for you. add this code in you above code.
.compose([
                          //left-axis
                        dc.lineChart("moveChart") // move chart is the compositeChart object.
                            .group(groupByDate) //group we created with corssfilter pass as argument
                    ])
moveChart.xAxis().ticks(4);
            moveChart.yAxis().ticks(5);
            moveChart.rightYAxis().ticks(5);

            dc.renderAll();
Output:
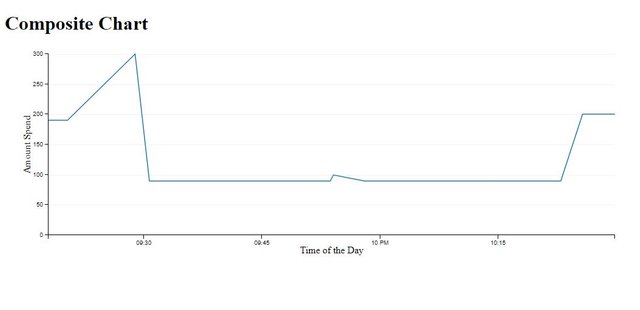
Once our left-axis created now we will create right-axis put a comma after first chart object as explained above and write the code to create 2nd graph object and its group. The grouped data for our 2nd graph will be 2nd grouped data we made from crossfilter. See how it'll be done
.compose([
                           //First Chart Object
                        dc.lineChart("moveChart")
                            .group(groupByDate),
                           //2nd Chart Object
                        dc.lineChart("moveChart")
                            .group(groupByTip)

                    ]) // other code will be the same
output:
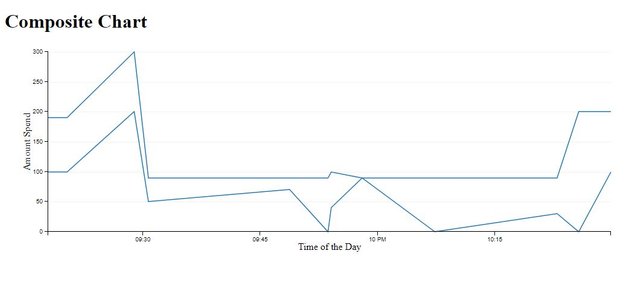
You can see still our both charts at left-axis, don't worry, here is one method .useRightYAxis(true) put this method under the chart object which to want at rights-axis. Here we want 2nd chart at rights-axis. We will put it under our 2nd object chart.
.compose([
                           //First Chart Object
                        dc.lineChart("moveChart")
                            .group(groupByDate),
                           //2nd Chart Object
                        dc.lineChart("moveChart")
                            .group(groupByTip)

                    ]) // other code will be the same
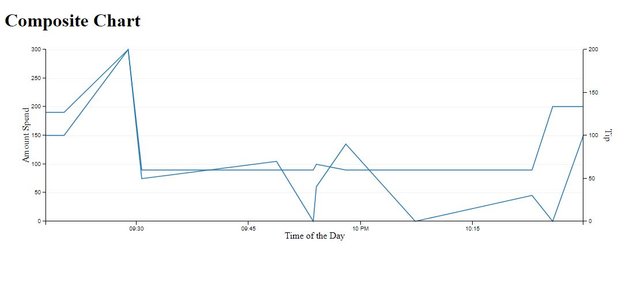
Here you can see right-axis but the our graph didn't look nice, same colors are confusing. Change the colors . Use this method to change .ordinalColors(["orange"]), place it under desired chart object. You can use different color name for different graphs, as we did Black for the 1st chart and orange for the 2nd chart.
.compose([
                        dc.lineChart("moveChart")
                            .group(groupByDate)
                            .ordinalColors(["black"]),

                        dc.lineChart("moveChart")
                            .group(groupByTip)
                            .ordinalColors(["orange"])
                            .useRightYAxis(true)

                    ]) // other code will be the same
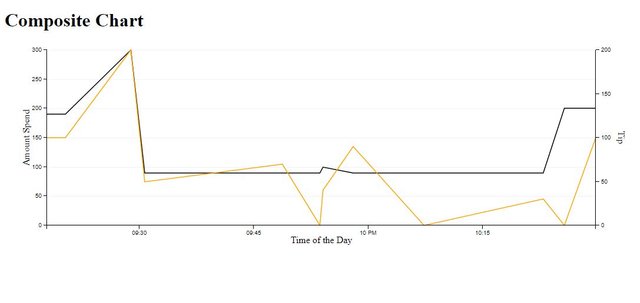
Here in one more problem, If you hover your cursor over the data points, it looks weird. So change the title with .title() method. As we did. Place it under the desired object chart
.title(function(d){
                                return "Tip: " + d.value; //value is the value of the our json data.
                            })
Above We change the title for the 2nd chart object . Same as above you can title of other object.
Output:
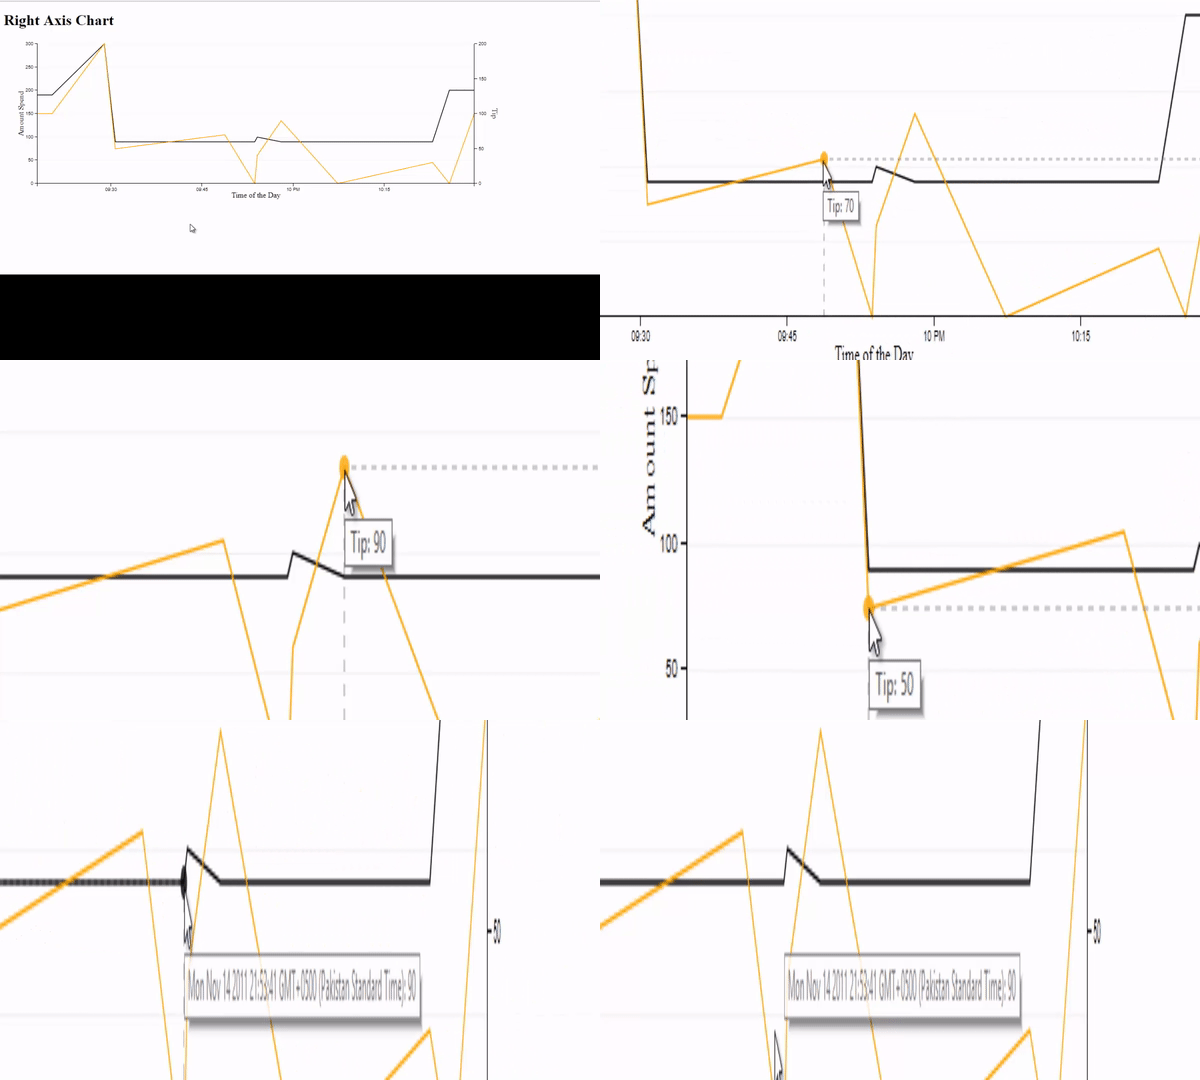
S, you can create composite charts as many you want we add here one more bar chart to the list.
.compose([
                        dc.lineChart("moveChart")
                            .group(groupByDate)
                            .title(function(d){
                                return d.key +": " +d.value;
                            })
                            .ordinalColors(["black"]),

                        dc.lineChart("moveChart")
                            .group(groupByTip)
                            .title(function(d){
                                return "Tip: " + d.value;
                            })
                            .ordinalColors(["orange"])
                            .useRightYAxis(true),

                         // 3rd Chart object
                        dc.barChart("moveChart")
                            .group(groupByTip)

                    ])
Output:
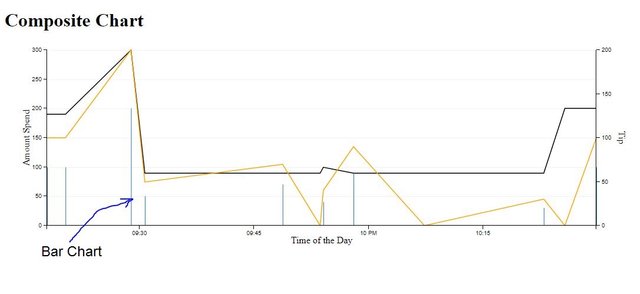
You can see the 3rd graph in our composite Chart.
Curriculum
- Tutorial #1 Dive into DC.JS a JavaScript Library - Bar Chart
- Tutorial #2 Dive into DC.JS a JavaScript Library - Pie Chart
- Tutorial #3 Dive into DC.JS a JavaScript Library - Line Chart
Posted on Utopian.io - Rewarding Open Source Contributors
Thank you for the contribution. It has been approved.
You can contact us on Discord.
[utopian-moderator]
Downvoting a post can decrease pending rewards and make it less visible. Common reasons:
Submit
Hey @creon, I just gave you a tip for your hard work on moderation. Upvote this comment to support the utopian moderators and increase your future rewards!
Downvoting a post can decrease pending rewards and make it less visible. Common reasons:
Submit
Hey @faad I am @utopian-io. I have just upvoted you!
Achievements
Suggestions
Get Noticed!
Community-Driven Witness!
I am the first and only Steem Community-Driven Witness. Participate on Discord. Lets GROW TOGETHER!
Up-vote this comment to grow my power and help Open Source contributions like this one. Want to chat? Join me on Discord https://discord.gg/Pc8HG9x
Downvoting a post can decrease pending rewards and make it less visible. Common reasons:
Submit