What Will I Learn?
- Create Dimension for Stacked Bar Chart from crossfilter.js
- Grouped data for Stacked Bar Chart from crossfilter.js
- Stacked Bar Chart from dc.js
Requirements
- Our previous tutorials
- Basics of HTML and CSS
- Intermediate level JavaScript
Difficulty
Either choose between the following options:
- Intermediate
Tutorial Contents
- What is Stacked Bar Chart
- Create working Environment
- Build Stacked Bar Chart
What is Stacked Bar Chart
If we talk about simple bar chart it uses for to simple comparison of the data. But if you want a complex comparison of data then you've use the upgraded bar chart, a Stacked Bar Chart. Stacked Bar Char is a type of Bar Chart, a stacked bar chart is similar to grouped bar chart. Grouped Bar Chart allow you to visualize two or more bars for each categorical group . These bars are color coded to represent a particular grouping. For example a person is running two business at the same time, then he can create bar chart to compare their resulting data.

Alternative to group bar chart, a stacked bar chart with different stack bars that visualize the different groups on top of each other. The height of the resulting bar shows the combined result value of the groups. Here you face one problem with stacked bar chart, it didn't work when there are negative values in the datasets. In this situation it good to use the grouped bar chart.
Create working Environment
To create our working environment we'll copy and paste working environment. Yeah, here in this tutorial we will use previous data set that we are using in previous tutorials. We just have to change the title and id of the div in our copied data. Here is the code.
<!DOCTYPE html>
<html lang="EN">
    <head>
      <meta charset="utf-8">
      <title>StackedBar Chart</title>
      <script type="text/javascript" src="https://cdnjs.cloudflare.com/ajax/libs/d3/3.5.1/d3.min.js"></script>
      <script type="text/javascript" src="https://cdnjs.cloudflare.com/ajax/libs/crossfilter/1.3.12/crossfilter.min.js"></script>
      <script type="text/javascript" src="https://cdnjs.cloudflare.com/ajax/libs/dc/2.1.9/dc.min.js"></script>
      <link rel="stylesheet" type="text/css" href="https://cdnjs.cloudflare.com/ajax/libs/dc/2.1.9/dc.min.css" />
    </head>
    <body>
        <h1>StackedBart Chart:By Type and Quantity</h1>
        <div id="stackedBarChart"></div>

        <script type="text/javascript">


          var paymentsRecord = [
          {date: "2011-11-14T16:17:54Z", quantity: 2, total: 190, tip: 100, type: "tab"},
          {date: "2011-11-14T16:20:19Z", quantity: 2, total: 190, tip: 100, type: "tab"},
          {date: "2011-11-14T16:28:54Z", quantity: 1, total: 300, tip: 200, type: "visa"},
          {date: "2011-11-14T16:30:43Z", quantity: 2, total: 90, tip: 0, type: "tab"},
          {date: "2011-11-14T16:48:46Z", quantity: 2, total: 90, tip: 0, type: "tab"},
          {date: "2011-11-14T16:53:41Z", quantity: 2, total: 90, tip: 0, type: "tab"},
          {date: "2011-11-14T16:54:06Z", quantity: 1, total: 100, tip: 0, type: "cash"},
          {date: "2011-11-14T16:58:03Z", quantity: 2, total: 90, tip: 0, type: "tab"},
          {date: "2011-11-14T17:07:21Z", quantity: 2, total: 90, tip: 0, type: "tab"},
          {date: "2011-11-14T17:22:59Z", quantity: 2, total: 90, tip: 0, type: "tab"},
          {date: "2011-11-14T17:25:45Z", quantity: 2, total: 200, tip: 0, type: "cash"},
          {date: "2011-11-14T17:29:52Z", quantity: 1, total: 200, tip: 100, type: "visa"}
        ];

          var facts = crossfilter(paymentsRecord);
        </script>

    </body>
</html>
We copied the data from our previous tutorial from HTML tag to the feeding the data to the crossfilter.js After this we change the title and ID of the div That's it here we are ready to work on stacked bar chart.
Build Stacked Bar Chart
Here in this tutorial we'll create a stacked bar chart form our give json data, we'll create stacked bar chart: total payment Type against the quantity.
Created dimension
So, Lets' move to our graph, as usual, first we'll create the dimension of the data, as mentioned the graph will be the type of the payment against data, The dimension will be the Type of the payment. For this write the code
var dimensionByType = facts.dimension(function(d){ return d.type; });
Created Groups
Then we create from our data, here for our graph we have to create multiple groups. For our graph create groups of Quantity of the basis of its value.
For this we'll use the reduce() method of the crossfilter.js library. We you've seen in our previous tutorials we used reduceCount to count the number of row in our data, and reduceSum()method to sum records using the specified value accessor.
The reduce method is the parent of reduceSum and reduceCount. So, by using the only reduce method you can create your own aggregating data. To this use the reduce method to our group method.
var groupByType = dimensionByType.group().reduce(reduceAdd,reduceRemove,reduceInitial);
Here above you can see reduce method takes three functions reduceAdd, reduceRemove, reduceInitial. Now we'll build these three methods.
First we talked about the reduceInitial method, you can say its the starting point for the our reduceAdd and reduceRemove methods. This method take no argument and returns the zero value. But in our case we 'll return an object. Our reduceInitial method will be
function reduceInitial(){
              return {};
          }
Now, our 2nd method is reduceAdd, it take two arguments, first is the initial value from our reduceInitial method and the second is the data sets. Our reduceAddmethod will be the
function reduceAdd(p, v){
              p[v.quantity] = (p[v.quantity]||0) + v.total; return p;
          }
Our third function, reduceRemove will be same as the the reduceAdd but with just a little change we use - sign instead of +.
function reduceRemove(p, v){
              p[v.quantity] = (p[v.quantity]||0) - v.total; return p;
          }
Once we created dimension and group from our dataset, we are ready to build our staked bar chart. As you know a stacked bar chart is type of bar chart. So, the barChart object to create our chart. Then set its width and height and then dimension and group. Also set the x-axis, here we use ordinal x-axis.
          var barChart = dc.barChart("#stackedBarChart")
                    .width(1024)
                    .height(200)
                    .dimension(dimensionByType)
                    .group(groupByType)
                    .x(d3.scale.ordinal().domain(['tab','visa','cash']))
                    .xUnits(dc.units.ordinal)
If you see the output, there will be and empty chart, here you just have to modify the group method
.group(groupByType,"Quantity: 1",function(d){ return d.value[1] || 0; })
Pass the 3 arguments, first is the group that we create above, 2nd is the name and the 3rd is the Quantity number.
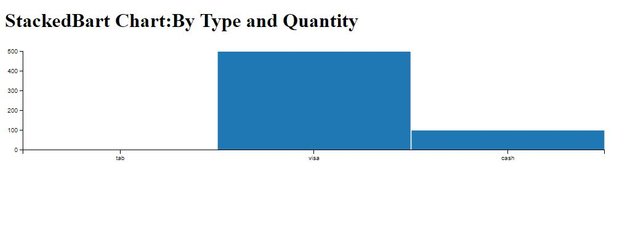
output:

Here in the out put you can see there is a single grouped chart for the quantity 1, to create a stacked chart we'll have to create bars for the quantity 2. To create stacks for the 2nd group here we'll use the barChart class method .stack(), add this code to your above code.
.stack(groupByType,"Quantity: 2",function(d){ return d.value[2]; })
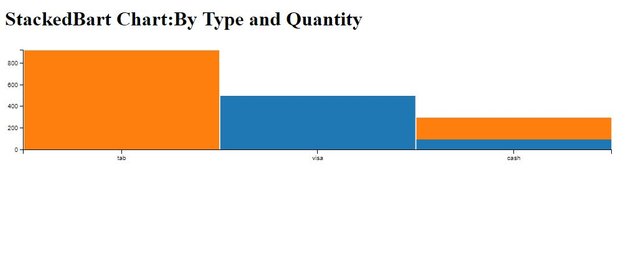
Output:

You can see our stack bar chart created for 2 groups, you can see in our datasets the "quantity" is with value of 1 and 2. So, here our chart is completed. What if we have 3rd group. if we replace one quantity with 3. Then we have to just add a number 3 in our .stack method.
.stack(groupByType,"Quantity: 3",function(d){ return d.value[3]; })
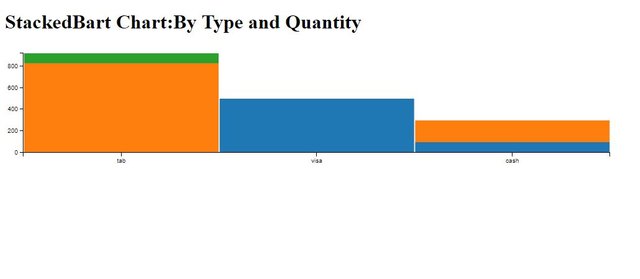
output

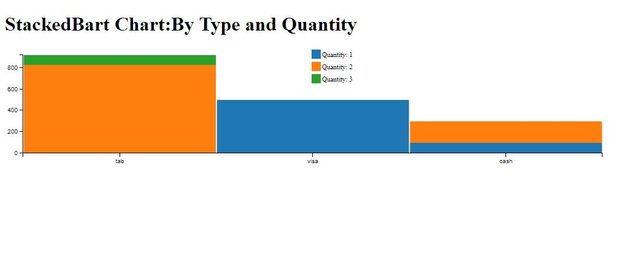
Here you can see the 3rd bar with green color. Now at last we just have to create the legend for our stacks to make difference from each other. Put this code in your above code.

Curriculum
Tutorial #5 Dive into DC.JS a JavaScript Library - Scatter Plot
Tutorial #4 Dive into DC.JS a JavaScript Library - Composite Chart [Left, Right]
Tutorial #3 Dive into DC.JS a JavaScript Library - Line Chart
Tutorial #2 Dive into DC.JS a JavaScript Library - Pie Chart
Tutorial #1 Dive into DC.JS a JavaScript Library - Bar Chart
Posted on Utopian.io - Rewarding Open Source Contributors
Thank you for the contribution. It has been approved.
You can contact us on Discord.
[utopian-moderator]
Downvoting a post can decrease pending rewards and make it less visible. Common reasons:
Submit
Hey @cha0s0000, I just gave you a tip for your hard work on moderation. Upvote this comment to support the utopian moderators and increase your future rewards!
Downvoting a post can decrease pending rewards and make it less visible. Common reasons:
Submit
Hey @faad I am @utopian-io. I have just upvoted you!
Achievements
Suggestions
Get Noticed!
Community-Driven Witness!
I am the first and only Steem Community-Driven Witness. Participate on Discord. Lets GROW TOGETHER!
Up-vote this comment to grow my power and help Open Source contributions like this one. Want to chat? Join me on Discord https://discord.gg/Pc8HG9x
Downvoting a post can decrease pending rewards and make it less visible. Common reasons:
Submit