What Will I Learn?
- Series Chart in dc.js
- Series Line Chart
- Series Bar Chart
- work with seriesChart methods
Requirements
- Basics of HTML and CSS
- Intermediate Level JavaScript
- Knowledge about Statistical Data
Difficulty
- Intermediate
Tutorial Contents
- Introduction
- Create Working Environment
- Build Series Chart
Introduction
In this tutorial we are going to develop a series chart, a series chart is a chart that visualize you data on a chart like Line Chart or Bar Chart. Series chart is something like composite chart, contains all the feature of composite except recomposing the chart.
Today we are going to develop series chart for the of morely experiments, you can download morely experiment data form the link download it in you working directory. This will be downloaded in csv file format.
In this tutorial we'll work with the data in csv format instead of json data.

Create Working Environment
Move toward our series chart using dc.js library first we've to develop the working environment to work with this library. First create an HTML files and save it with name seriesChart.html. Then write all the basic code for the HTML files.
<!DOCTYPE html>
<html lang="EN">
    <head>
      <meta charset="utf-8">
      <title>Series Chart</title>
    </head>
    <body>
    <body>
<html>
Then write the code for heading of the page and div in which you want show your chart and assign it the ID.
        <h1>Series Chart: Morely Experiment</h1>
        <div id="seriesChart"></div>
Now link the dc.js library and the other libraries dc.js depends upon d3.js and crossfilter.js
      <script type="text/javascript" src="https://cdnjs.cloudflare.com/ajax/libs/d3/3.5.1/d3.min.js"></script>
      <script type="text/javascript" src="https://cdnjs.cloudflare.com/ajax/libs/crossfilter/1.3.12/crossfilter.min.js"></script>
      <script type="text/javascript" src="https://cdnjs.cloudflare.com/ajax/libs/dc/2.1.9/dc.min.js"></script>
      <link rel="stylesheet" type="text/css" href="https://cdnjs.cloudflare.com/ajax/libs/dc/2.1.9/dc.min.css" />
Build Series Chart
Above we've developed our working environment, now we'll move to our series chart. You know we have the data in csv format. D3.js allow us to work with csv data. For this we'll use the csv([arg1, arg2]) of d3 class. write the code, after we discuss about it.
d3.csv("morley.csv", function(error, exp){
// here we'll do our whole work
});
csv([arg1, arg2]) method takes two arguments first is the name of the csv file and is the method in which we do whole stuff. You can see method we passed as argument also takes two arguments error and exp,
error tells us the error happened in our code and exp is the experiment data we pass through our csv file.
Now our whole code will be withing the function, we mentioned above in code. You can see csv file data in the console writing this code.
console.log(exp);
The data value we receive is in string format change the value string into integer value. write this code.
            exp.forEach(function(d){

                d.Speed = +d.Speed; // tells the javascript it are dealing with  number
                d.Expt = +d.Expt;
                d.Run = +d.Run;
            });
Now you have to feed the data to the corssfilter.js and then we create dimension and of the data and also the grouped the data through corssfilter library. For this write the code
var facts = crossfilter(experiments);

var runDimension = facts.dimension(function(d){ return [d.Expt,d.Run]; });
var runGroup = runDimension.group().reduceSum(function(d){ return d.Speed; });
Now we'll move to our series chart, create the object of the series chart, set the width and height of the chart after that add the dimension and group of the chart that we created above through corssfilter.
var series = dc.seriesChart("#chart")
    .width(1360)
    .height(300)
    .dimension(runDimension)
    .group(runGroup)
set the margin of the chart with .margin([]) method
.margins({top:40,bottom:60,right:80,left:60})
seriesChart provide us a special method .chart([]) , this method allow us to generate the sub-charts or child charts for us. So, generate child chart using this method in your code.
.chart(function(chart){ return dc.barChart(chart); })
Here above we created line chart as our sub chart.
Now we have to set the x-axis positioning in our for our chart. We do this with keyAccessor([]) method. This method take the key accessor and retrieve the value for each point in the graph.
.keyAccessor(function(d){ return d.key[1]; })
After setting x-axis positioning now we'll set the y-axis position of the data points. For this we use the .valueAccessor([]) method. This method take the accessor value and retrieve the value for each data point in the chart.
.valueAccessor(function(d){ return d.value; })
After doing this we will displays the different series in our chart for different experiments. This will be done with help of .seriesAccessor( [accessor]) method, this method given a datum, this method should return the series that datum belongs to.
.seriesAccessor(function(d){ return d.key[0]; })
label the x-axis and y-axis to create a nice and clean chart.
                        .xAxisLabel("X Axis")
                        .yAxisLabel("Y Axis")
Now at the end render the chart dc.renderAll();
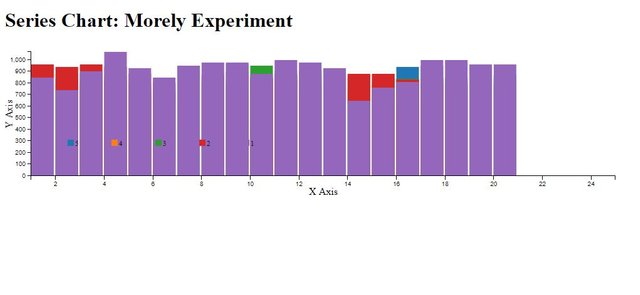
output:

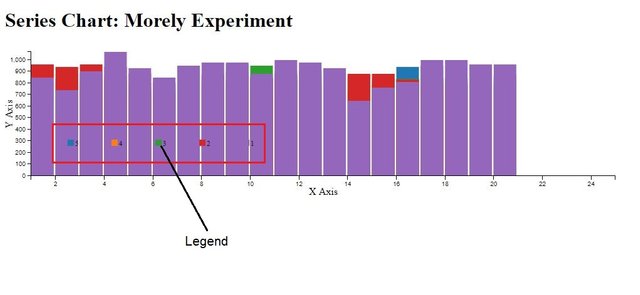
Also make the legends in the chart for a better view of the chart.
.legend(dc.legend().x(100).y(150).itemHeight(10).gap(5).horizontal(3))
output:

There are two more methods of seriesChart class
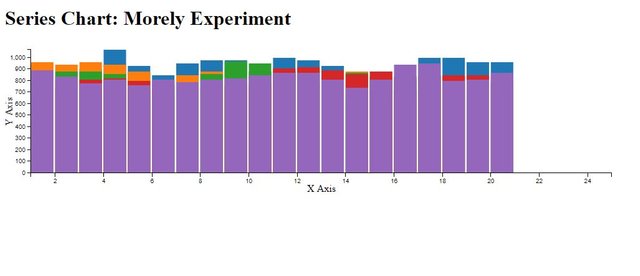
seriesSort( [sortFunction])Sort the series in the chartvalueSort( [sortFunction])sort the values in each series
You can apply this in your code as.
.seriesSort(d3.descending);

.valueSort(function keySort (a, b) {
    return d3.ascending(seriesChart.keyAccessor()(a),  seriesChar.keyAccessor()(b));
});
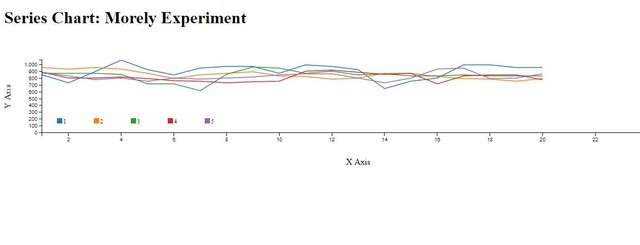
You can also change our series bar chart into series line chart. You just have make little change in your .chart([]) method, replace the barChar to lineChart .
.chart(function(chart){ return dc.lineChart(chart); })
output:

Source Code:
<!DOCTYPE html>
<html lang="EN">
    <head>
      <meta charset="utf-8">
      <title>Series Chart</title>
      <script type="text/javascript" src="https://cdnjs.cloudflare.com/ajax/libs/d3/3.5.1/d3.min.js"></script>
      <script type="text/javascript" src="https://cdnjs.cloudflare.com/ajax/libs/crossfilter/1.3.12/crossfilter.min.js"></script>
      <script type="text/javascript" src="https://cdnjs.cloudflare.com/ajax/libs/dc/2.1.9/dc.min.js"></script>
      <link rel="stylesheet" type="text/css" href="https://cdnjs.cloudflare.com/ajax/libs/dc/2.1.9/dc.min.css" />
    </head>
    <body>
        <h1>Series Chart: Morely Experiment</h1>
        <div id="seriesChart"></div>


        <script language="javascript">
            d3.csv("morley.csv", function(error, exp){
                console.log(exp);
            exp.forEach(function(d){
                d.Speed = +d.Speed;
                d.Expt = +d.Expt;
                d.Run = +d.Run;
            });

            var facts = crossfilter(exp);

            var dimensionByRun = facts.dimension(function(d){ return [d.Expt, d.Run]; });
            var groupByRun = dimensionByRun.group().reduceSum(function(d){ return d.Speed;})

            var seriesChart = dc.seriesChart("#seriesChart")
                        .width(1350)
                        .height(250)
                        .margins({top:40,bottom:60,right:80,left:60})
                        .dimension(dimensionByRun)
                        .chart(function(chart){ return dc.barChart(chart); })
                        .group(groupByRun)
                        .keyAccessor(function(d){ return d.key[1]; })
                        .valueAccessor(function(d){ return d.value; })
                        .seriesAccessor(function(d){ return d.key[0]; })
                        .x(d3.scale.linear().domain([1,25]))
                        .legend(dc.legend().x(100).y(150).itemHeight(10).gap(5).horizontal(3))
                        .xAxisLabel("X Axis")
                        .yAxisLabel("Y Axis")

                dc.renderAll();

            });
        </script>

    </body>
</html>
Curriculum
Tutorial #8 Dive into DC.JS a JavaScript Library - Bubble Chart
Tutorial #7 Dive into DC.JS a JavaScript Library - Data Table
Tutorial #6 Dive into DC.JS a JavaScript Library - Stacked Bar Chart
Tutorial #5 Dive into DC.JS a JavaScript Library - Scatter Plot
Tutorial #4 Dive into DC.JS a JavaScript Library - Composite Chart [Left, Right]
Tutorial #3 Dive into DC.JS a JavaScript Library - Line Chart
Tutorial #2 Dive into DC.JS a JavaScript Library - Pie Chart
Tutorial #1 Dive into DC.JS a JavaScript Library - Bar Chart
Posted on Utopian.io - Rewarding Open Source Contributors
Thank you for the contribution. It has been approved.
You can contact us on Discord.
[utopian-moderator]
Downvoting a post can decrease pending rewards and make it less visible. Common reasons:
Submit
Hey @faad I am @utopian-io. I have just upvoted you!
Achievements
Community-Driven Witness!
I am the first and only Steem Community-Driven Witness. Participate on Discord. Lets GROW TOGETHER!
Up-vote this comment to grow my power and help Open Source contributions like this one. Want to chat? Join me on Discord https://discord.gg/Pc8HG9x
Downvoting a post can decrease pending rewards and make it less visible. Common reasons:
Submit