What Will I Learn?
- How to use G2 js (The grammar of graphics)
- How to create bar chart using g2
- Example codes using g2
Requirements
- Knowledge of HTML
- Knowledge of JavaScript
Difficulty
- Intermediate
Tutorial Contents
- Introduction
- Import G2 js
- Create bar chart
Introduction
G2, The Grammar of Graphics, is a data-driven visual language developed by the AntV Team. This javascript library can create different kinds of charts and graphs with a high level of usability and scalability and this will render your charts/graphs using canvas. G2 is a great tool to help developers for data visualization on their applications. In this tutorial, we will cover on how create a bar chart.
"With G2, users can describe the visual appearance of a visualization just by one statement." - AntV Team
Import
Before we can use the library, we have to import a javascript file on our application. We can just use a CDN or download the file in our local machine.
CDN: https://gw.alipayobjects.com/os/antv/assets/g2/3.0.5-beta.5/g2.min.js
Then, add the javascript file in our application using the script tag.
<script src="https://gw.alipayobjects.com/os/antv/assets/g2/3.0.5-beta.5/g2.min.js"></script>
Create Bar Chart
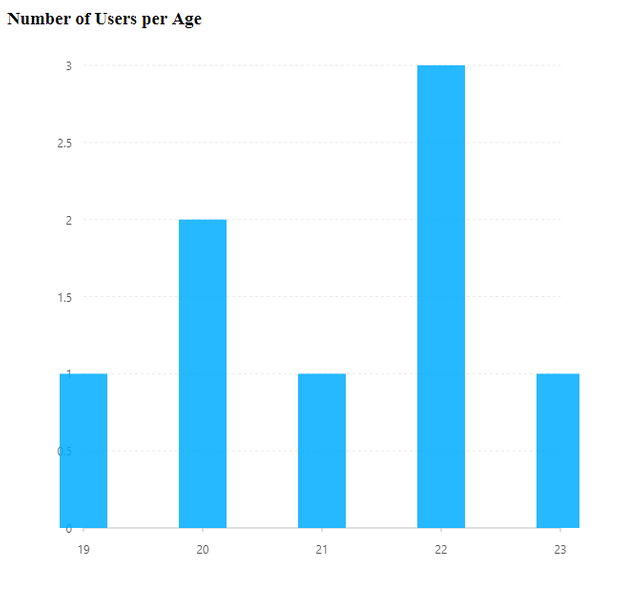
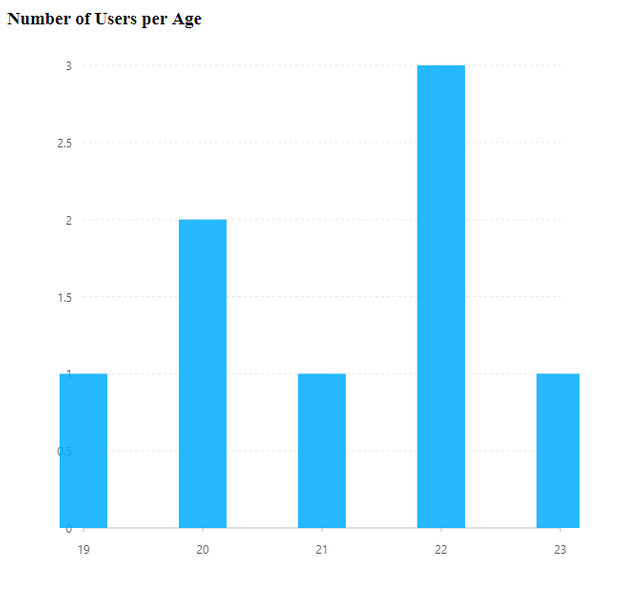
In this tutorial, we will create a bar chart that will display the number of users per age.
- First, we need to get/initialize the data for the bar chart. For that, we will just create a sample array of users with their corresponding age.
var data = [
        {"name" : "John", "age" : 20},
        {"name" : "Mary", "age" : 23},
        {"name" : "Susan", "age" : 22},
        {"name" : "Bernard", "age" : 19},
        {"name" : "Joe", "age" : 20},
        {"name" : "Elen", "age" : 22},
        {"name" : "George", "age" : 22},
        {"name" : "Michael", "age" : 21},
];
Then, we have to group this array of users by age with a new count attribute. In this example, we will use the data-set library by AntV. But you can also use a vanilla javascript function to group the users by age.
To use the data-set library, we have to import another javascript file.
<script src="https://gw.alipayobjects.com/os/antv/assets/data-set/0.8.5/data-set.min.js"></script>
- Then use the library to transform the data.
var dataSet = new DataSet();
var newData= dataSet.createView('test')
            .source(data)
            .transform({
                  as: [ 'count' ],
                  groupBy: [ 'age' ],
                  type: 'aggregate'
            });
- Or you can use vanilla javascript:
var result = [];

data.forEach(function (element) {
       var existingElement = result.filter(function (item) {
              return item.age === element.age;
        })[0];

        if (existingElement) {
             existingElement.count++;
         } else {
               var newData = {
                    age : element.age,
                    count : 1
                }
                result.push(newData);
           }
});
- Before we can create the chart, we have to create first an html container where we can display it.
<div id="container"></div>
- Then, we can initialize/create the G2 chart.
var chart = new G2.Chart({
          container: 'container', // container ID
          width : 600, // width of chart
          height : 600 // height of chart
});
- After that, we have to set the data source for the chart.
chart.source(newData);
- Then, we have to set the syntax for the position of the columns or what should be displayed on x and y axis of the chart.
chart.interval().position('age*count'); // (x*y)
- Lastly, RENDER the bar chart.
chart.render();
Result:

Posted on Utopian.io - Rewarding Open Source Contributors
Thank you for the contribution. It has been approved.
You can contact us on Discord.
[utopian-moderator]
Downvoting a post can decrease pending rewards and make it less visible. Common reasons:
Submit
Hey @portugalcoin, I just gave you a tip for your hard work on moderation. Upvote this comment to support the utopian moderators and increase your future rewards!
Downvoting a post can decrease pending rewards and make it less visible. Common reasons:
Submit
Hi @portugalcoin Thank you!
Downvoting a post can decrease pending rewards and make it less visible. Common reasons:
Submit
Hey @gentlemanoi I am @utopian-io. I have just upvoted you!
Achievements
Community-Driven Witness!
I am the first and only Steem Community-Driven Witness. Participate on Discord. Lets GROW TOGETHER!
Up-vote this comment to grow my power and help Open Source contributions like this one. Want to chat? Join me on Discord https://discord.gg/Pc8HG9x
Downvoting a post can decrease pending rewards and make it less visible. Common reasons:
Submit