What Will I Learn?
- How to create pie chart using g2
- Example codes using g2
Requirements
- Knowledge of HTML
- Knowledge of JavaScript
Difficulty
- Intermediate
Tutorial Contents
- Introduction
- Import G2 js
- Create pie chart
Introduction
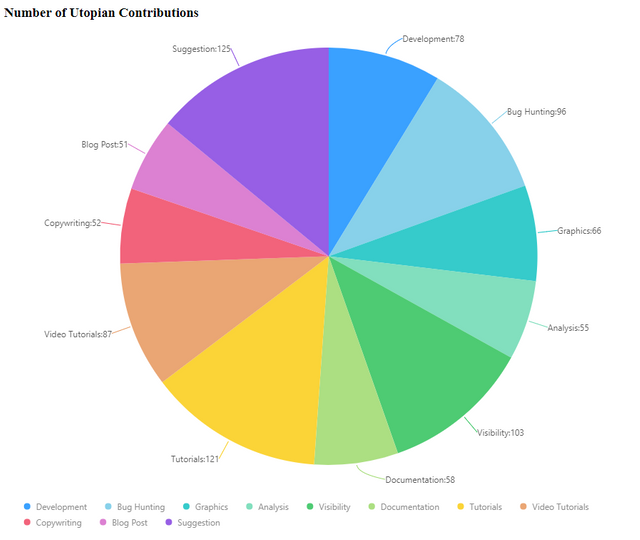
In this tutorial, we will create a simple pie chart that will display the sample number of utopian contributions.
Pie chart is a circular graph that represents a statistical data. This graph is divided into slices which illustrate the numerical proportion. The arc length of each slices is proportional to the number of quantity it represents. Using pie chart is a way of summarizing a set of categorical data or shows percentage distribution.
Import G2 js
To start, we have to import first the G2 library in our application. We can use a CDN or dowload/copy+paste the file into our local machine.
CDN: https://gw.alipayobjects.com/os/antv/assets/g2/3.0.5-beta.5/g2.min.js
Then, add a script tag in our application to import the G2 library.
<script src="https://gw.alipayobjects.com/os/antv/assets/g2/3.0.5-beta.5/g2.min.js"></script>
Create pie chart
So let's start creating our pie chart.
- First, we need to initialize the data in
JSONformat. We can use any data which will be displayed in our pie chart. For this tutorial, we will create a pie chart that will display the percentage of each Utopian contributions.
var data = [
        { contribution: 'Development', count: 78 },
        { contribution: 'Bug Hunting', count: 96 },
        { contribution: 'Graphics', count: 66 },
        { contribution: 'Analysis', count: 55 },
        { contribution: 'Visibility', count: 103 },
        { contribution: 'Documentation', count: 58 },
        { contribution: 'Tutorials', count: 121 },
        { contribution: 'Video Tutorials', count: 87 },
        { contribution: 'Copywriting', count: 52 },
        { contribution: 'Blog Post', count: 51   },
        { contribution: 'Suggestion', count: 125 },
 ];
- Then, initialize the G2 chart with the element or container where we want to display the chart and we can also set the height and the width.
var chart = new G2.Chart({
        container: 'canvas',
        height: 700,
        width: 850
 });
- Pass the
JSONdata to the G2 chart as the source data.
chart.source(data);
- Use
coordto set the Cartesian coordinate that we will use. There are four types of coord: rect, polar, theta, and helix. For circular graphs we will use the theta coord type.
chart.coord('theta');
- Next, set the position of the interval that will determine what attribute of data we will use to illustrate the percentage of each slices. Instead of
intervalwe will useintervalStackfor circular graphs. And also we will set the color and label of each slices. For the color, we will just set what attribute of object that we need to emphasize.
chart.intervalStack().position('count').color('contribution')
        .label('contribution*count', {
          content(name, value) {
            return name + ':' + value;
          }
  });
For the label, we have to pass the attributes that we want to display and use the content function that will return the label as a string.
- Lastly, RENDER the pie chart.
chart.render();
Result:

Curriculum
Posted on Utopian.io - Rewarding Open Source Contributors
Your contribution cannot be approved because it does not follow the Utopian Rules.
Explanation: again, you didn't explain anything just dropped in code.
For example:
^^^ Why use
theta? What do all these four coordinate types do?And:
^^^ Why? What does
interval()do? What doesintervalStack()do?Other than this, you again just imported the g2.js CDN in your
<head>section, dropped in a dummy data array (that's fine), instantiated aG2.Chart()object and dropped in the data.You can contact us on Discord.
[utopian-moderator]
Downvoting a post can decrease pending rewards and make it less visible. Common reasons:
Submit