What Will I Learn?
- What is funnel chart
- How to create funnel chart using g2
- Example codes using g2
Requirements
- Knowledge of HTML
- Knowledge of JavaScript
Difficulty
- Intermediate
Tutorial Contents
- Introduction
- Import G2 js
- Create funnel chart
Introduction
In this tutorial, we will learn how to create funnel chart using G2 (The Grammar of Graphics) by AntV Team.
What is Funnel Chart?
Funnel Chart is a type of chart that looks like a funnel. This chart represents stages of a process. It displays values that are progressively decreasing in size. The top of chart is called the head or the base and the lower part is called the neck. Note that this chart is not like a real funnel, everything that are on the top doesn't mean that it will go down to the bottom. The name only represents the shape of the chart.
Import G2 js
Before we can create the chart, we will need to import the G2 library so that we can use its functionalities. For that, we can use a CDN or we can copy+paste the file and save it in our local machine.
CDN: https://gw.alipayobjects.com/os/antv/assets/g2/3.0.5-beta.5/g2.min.js
Then, add a script tag in our application to import the G2 library.
<script src="https://gw.alipayobjects.com/os/antv/assets/g2/3.0.5-beta.5/g2.min.js"></script>
Create funnel chart
So let's start creating our funnel chart!
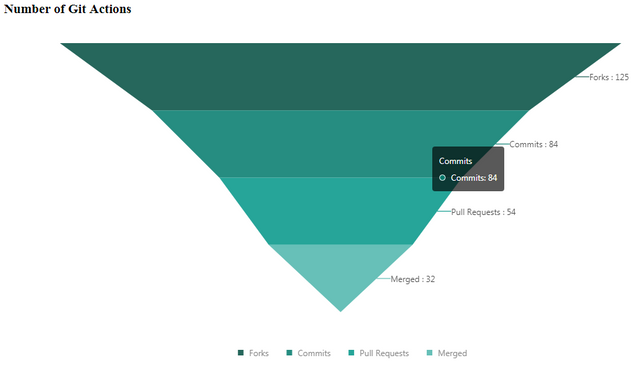
- First, we have to initialize the data that we will use in our funnel chart. For this tutorial, we will create a funnel chart that contains the number of Git actions like forks, commits, pull requests and merged pull requests.
var data = [
          { action: 'Forks', value: 125 },
          { action: 'Commits', value: 84 },
          { action: 'Pull Requests', value: 54 },
          { action: 'Merged', value: 32 }
];
- Next, we also need to initialize the G2 Chart. We will set the element container that will display our funnel chart and we will also set the height and the width of the chart.
var chart = new G2.Chart({
          container: 'canvas',
          height: 500,
          width: 1000
});
- Then pass the data to our G2 chart as the source data.
chart.source(data);
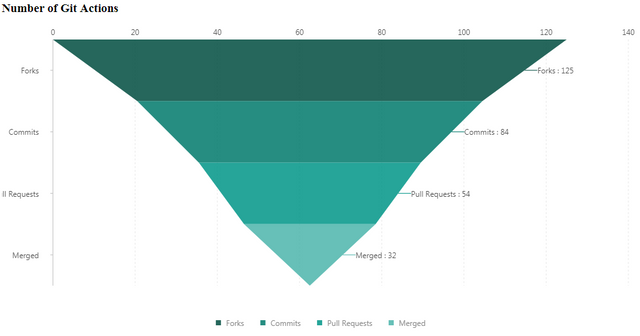
- If you want to remove the y-axis label of our chart, you can use chart axis function and set it to false. The default value is true.
chart.axis(false);
This will be the result if we will not set the axis to false.

- Then we will have to set the coordinate system to Cartesian type because we will need the x and y dimensions for the value. We will use
rectto set the chart as a cartesian type.
chart.coord('rect').scale(1, -1).transpose(); // scale(xCoord, yCoord);
The scale function is used to scale or set the size of the x and y unit for each stage. Positive x and y value will have a normal Cartesian plane with an increasing value from right to left and bottom to top. While the negative value will reverse the direction.
And the transpose function will re-position or replace the chart base on the given coordinates.
- Then, we will use the intervalSymmetric and shape function to set the chart just like a symmetrical reverse pyramid. We can also set the color of each stage by using the color function.
chart.intervalSymmetric()
            .shape('pyramid')
            .color('action', [ '#004D40', '#00796B', '#009688', '#4DB6AC', '#B2DFDB' ]) //color : from top to bottom
            .position('action*value')
            .label('action*value', {
                labelLine: {
                  lineWidth: 1
                },
                content(name, value){
                    return name + " : " + value;
                }
            });
And set the position of the chart because this will determine what attribute of data we will use to illustrate the value of each stages. (name*value) pair. The label function will set the label of each stages.
labelLine : to draw a line from the label to a stage where the label belongs.
content : will return a string that will be displayed. The parameters are data from the parameters of label function.
- Lastly, RENDER the funnel chart.
Result:

Curriculum
- Tutorial #1 G2 (The Grammar of Graphics) - Create Bar Chart
- Tutorial #2 G2 (The Grammar of Graphics) - Create Pie Chart
Posted on Utopian.io - Rewarding Open Source Contributors
Thank you for the contribution. It has been approved.
Nota bene:
In this tutorial you did explain something, being:
You didn't explain other things like:
Concluding: I think you should have combined the 3 tutorials I just moderated as one, then you shouldn't have to keep on explaining importing g2.js over and over again: same info everywhere.
I want you to explain why you choose to use a certain method over another one, explain to the reader what each of them does, and why they should use X or Y.
Please be more in-depth and verbose on explaining your new tuts. But if you do it well, if it is really interesting, not only will I accept them but you can have my personal upvote as well.
Good luck!
@scipio
You can contact us on Discord.
[utopian-moderator]
Downvoting a post can decrease pending rewards and make it less visible. Common reasons:
Submit
Thank you sir. I will try to explain in more detail next time :D
Downvoting a post can decrease pending rewards and make it less visible. Common reasons:
Submit
Hey @gentlemanoi I am @utopian-io. I have just upvoted you!
Achievements
Community-Driven Witness!
I am the first and only Steem Community-Driven Witness. Participate on Discord. Lets GROW TOGETHER!
Up-vote this comment to grow my power and help Open Source contributions like this one. Want to chat? Join me on Discord https://discord.gg/Pc8HG9x
Downvoting a post can decrease pending rewards and make it less visible. Common reasons:
Submit