Summary:
G2 is a set of graphically-based graphical syntax that is data-driven and highly user-friendly and extensible, allowing users to build a wide variety of interactive statistics without having to worry about detailed implementation details chart.
G2 是一套基于可视化编码的图形语法,以数据驱动,具有高度的易用性和扩展性,用户无需关注各种繁琐的实现细节,一条语句即可构建出各种各样的可交互的统计图表。
您将从这个教程中学到什么
- 如何引入js文件
- 如何定义图例颜色
- 如何引用数据
- 如何定义字段别名
- 如何格式化坐标轴的显示
- 如何定义提示框
- 如何渲染图表
学习此教程的必备条件
教程难度
- 难
教程内容
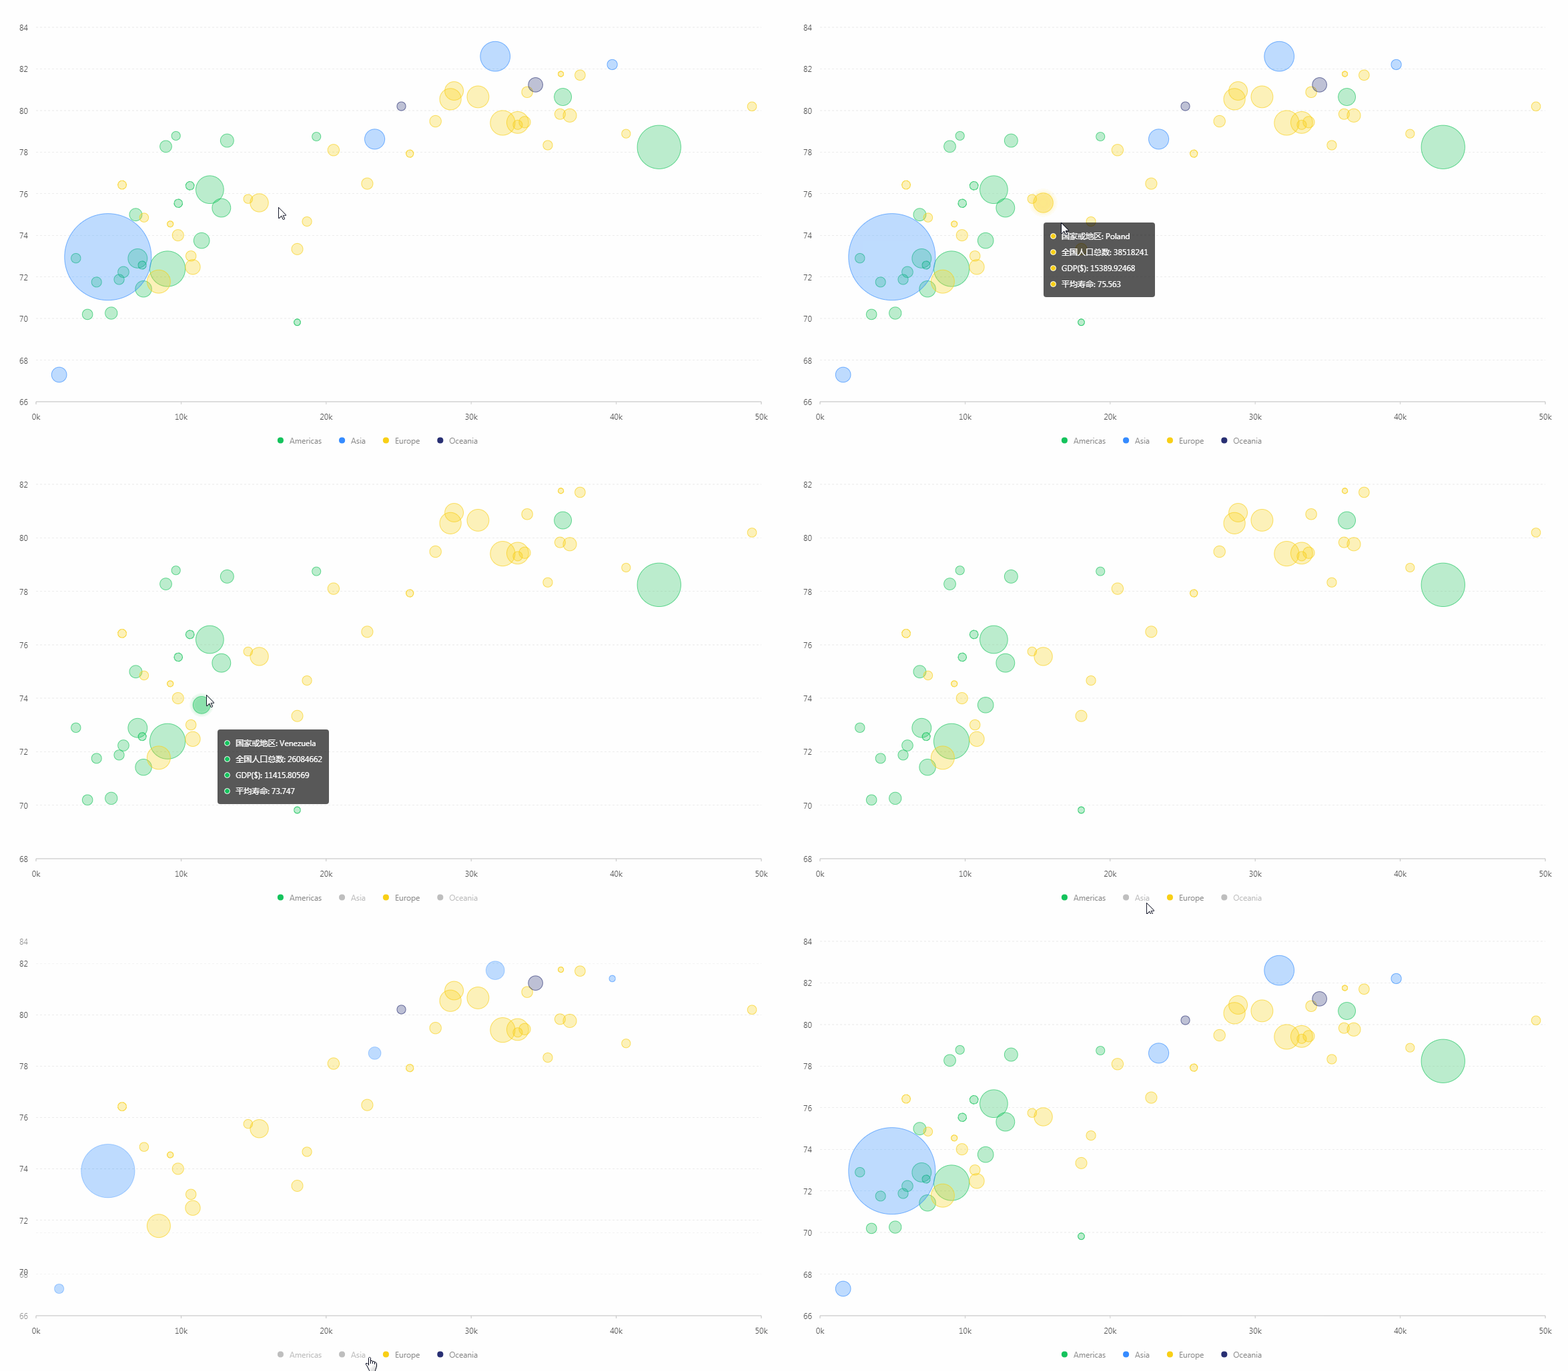
演示效果

1. 知识点A - 如何引入js文件
<script src="https://gw.alipayobjects.com/os/antv/assets/g2/3.0.4-beta.2/g2.min.js"></script>
<script src="https://gw.alipayobjects.com/os/antv/assets/data-set/0.8.3/data-set.min.js"></script>
<script src="https://gw.alipayobjects.com/os/antv/assets/lib/jquery-3.2.1.min.js"></script>
使用内嵌script对js文件进行引入,用于后期图表使用。
2. 知识点B - 如何定义图例颜色
  const { Global } = G2;
  const colorMap = {
    'Asia': Global.colors[0],
    'Americas': Global.colors[1],
    'Europe': Global.colors[2],
    'Oceania': Global.colors[3]
  };
使用数组的形式定义不同图例的颜色。
- Global:包含 G2 内部所有常量的定义以及皮肤。
3. 知识点C - 如何引用数据
  $.getJSON('/assets/data.json', function(data){
    const chart = new G2.Chart({
      container: 'bubblechart',
      forceFit: true,
      height: window.innerHeight
    });
    chart.source(data);
重点:本实例中,首次使用到getJSON的方式,从外部文件获取数据。
JSON文件内容说明(截取部分内容);
{"continent":"Americas","Country":"Argentina","LifeExpectancy":75.32,"GDP":12779.37964,"Population":40301927},{"continent":"Americas","Country":"Brazil","LifeExpectancy":72.39,"GDP":9065.800825,"Population":190010647}
JSON文件格式说明;
{"continent":"字段对应值","Country":"字段对应值","LifeExpectancy":字段对应值,"GDP":字段对应值,"Population":字段对应值}
- container:定于数据从bubblechart数组取值。
- forceFit: 定义图表的宽度自适应开关,默认为 false,设置为 true 时表示自动取 dom(实例容器)的宽度。
- height: 定义图表高度。
- source:定义为chart装载数据,返回chart对象。
4. 知识点D - 如何定义字段别名
    chart.scale({
      LifeExpectancy: {
        alias: '平均寿命'
      },
      Population: {
        type: 'pow',
        alias: '全国人口总数'
      },
      GDP: {
        alias: 'GDP($)'
      },
      Country: {
        alias: '国家或地区'
      }
    });
- scale:为指定的数据字段进行列定义,返回 chart 实例。
LifeExpectancy、Population、GDP、Country均与JSON文件中字段对应。
5. 知识点E - 如何格式化坐标轴的显示
    chart.axis('GDP', {
      label: {
        formatter: function (value) {
          return (value / 1000).toFixed(0) + 'k';
        }
      }
    });
- axis:坐标轴配置,该方法返回 chart 对象。
- formatter:回调函数,用于格式化坐标轴刻度点的文本显示,会影响数据在坐标轴 axis、图例 legend、tooltip 上的显示。
6. 知识点F - 如何定义提示框
    chart.tooltip({
      showTitle: false
    });
- showTitle:属性为false表示不显示默认标题。
7. 知识点G - 如何渲染图表
    chart.point().position('GDP*LifeExpectancy')
      .size('Population', [ 4, 65 ])
      .color('continent', val => {
        return colorMap[val];
      })
      .shape('circle')
      .tooltip('Country*Population*GDP*LifeExpectancy')
      .style('continent', {
        lineWidth: 1,
        strokeOpacity: 1,
        fillOpacity: 0.3,
        opacity: 0.65,
        stroke: val => {
          return colorMap[val];
        }
      });
    chart.render();
- point:创建点图图,返回一个 geom 对象。
- size:将数据值映射到图形的大小上的方法。使用字段映射到大小,并指定最大值和最小值
- color:将数据值映射到图形的颜色上的方法。
- shape:将数据值映射到图形的形状上的方法。值为circle,表示为圆形。
- tooltip:图表的 tooltip 配置,G2 图表的 tooltip 使用 html 渲染。
- render:图表绘制的最后一步,用于将图表渲染至画布。
完整代码
<html lang="en">
<head>
    <meta charset="UTF-8">
    <title>气泡图</title>
</head>
<body>
<div id="bubblechart"></div>
<script src="https://gw.alipayobjects.com/os/antv/assets/g2/3.0.4-beta.2/g2.min.js"></script>
<script src="https://gw.alipayobjects.com/os/antv/assets/data-set/0.8.3/data-set.min.js"></script>
<script src="https://gw.alipayobjects.com/os/antv/assets/lib/jquery-3.2.1.min.js"></script>
<script>
  const { Global } = G2;
  const colorMap = {
    'Asia': Global.colors[0],
    'Americas': Global.colors[1],
    'Europe': Global.colors[2],
    'Oceania': Global.colors[3]
  };
  $.getJSON('/assets/data.json', function(data){
    const chart = new G2.Chart({
      container: 'bubblechart',
      forceFit: true,
      height: window.innerHeight
    });
    chart.source(data);
    chart.scale({
      LifeExpectancy: {
        alias: '平均寿命'
      },
      Population: {
        type: 'pow',
        alias: '全国人口总数'
      },
      GDP: {
        alias: 'GDP($)'
      },
      Country: {
        alias: '国家或地区'
      }
    });
    chart.axis('GDP', {
      label: {
        formatter: function (value) {
          return (value / 1000).toFixed(0) + 'k';
        }
      }
    });
    chart.tooltip({
      showTitle: false
    });
    chart.legend('Population', false);
    chart.point().position('GDP*LifeExpectancy')
      .size('Population', [ 4, 65 ])
      .color('continent', val => {
        return colorMap[val];
      })
      .shape('circle')
      .tooltip('Country*Population*GDP*LifeExpectancy')
      .style('continent', {
        lineWidth: 1,
        strokeOpacity: 1,
        fillOpacity: 0.3,
        opacity: 0.65,
        stroke: val => {
          return colorMap[val];
        }
      });
    chart.render();
  });
</script>
</body>
</html>
最终效果

系列课程
如果您喜欢我的教程,可以在我的个人档案页面,获取更多信息。
您可以使用zqz-tutorial标签快速查看我发布的所有教程。
Posted on Utopian.io - Rewarding Open Source Contributors
Approve is not my ability, but I can upvote you.
Downvoting a post can decrease pending rewards and make it less visible. Common reasons:
Submit
Good to know you've started using G2
Thank you for the contribution. It has been approved.
You can contact us on Discord.
[utopian-moderator]
Downvoting a post can decrease pending rewards and make it less visible. Common reasons:
Submit
Thank you very much~
Downvoting a post can decrease pending rewards and make it less visible. Common reasons:
Submit
The contribution cannot be approved because it does not follow the Utopian Rules.
It is taken from the official documentation.
You can contact us on Discord.
[utopian-moderator]
Downvoting a post can decrease pending rewards and make it less visible. Common reasons:
Submit