Summary:
G2 is a set of graphically-based graphical syntax that is data-driven and highly user-friendly and extensible, allowing users to build a wide variety of interactive statistics without having to worry about detailed implementation details chart.
G2 是一套基于可视化编码的图形语法,以数据驱动,具有高度的易用性和扩展性,用户无需关注各种繁琐的实现细节,一条语句即可构建出各种各样的可交互的统计图表。
您将从这个教程中学到什么
- 如何引入js文件
- 如何定义容器
- 如何定义数据
- 如何引用数据
- 如何渲染图表
学习此教程的必备条件
教程难度
- 容易
教程内容
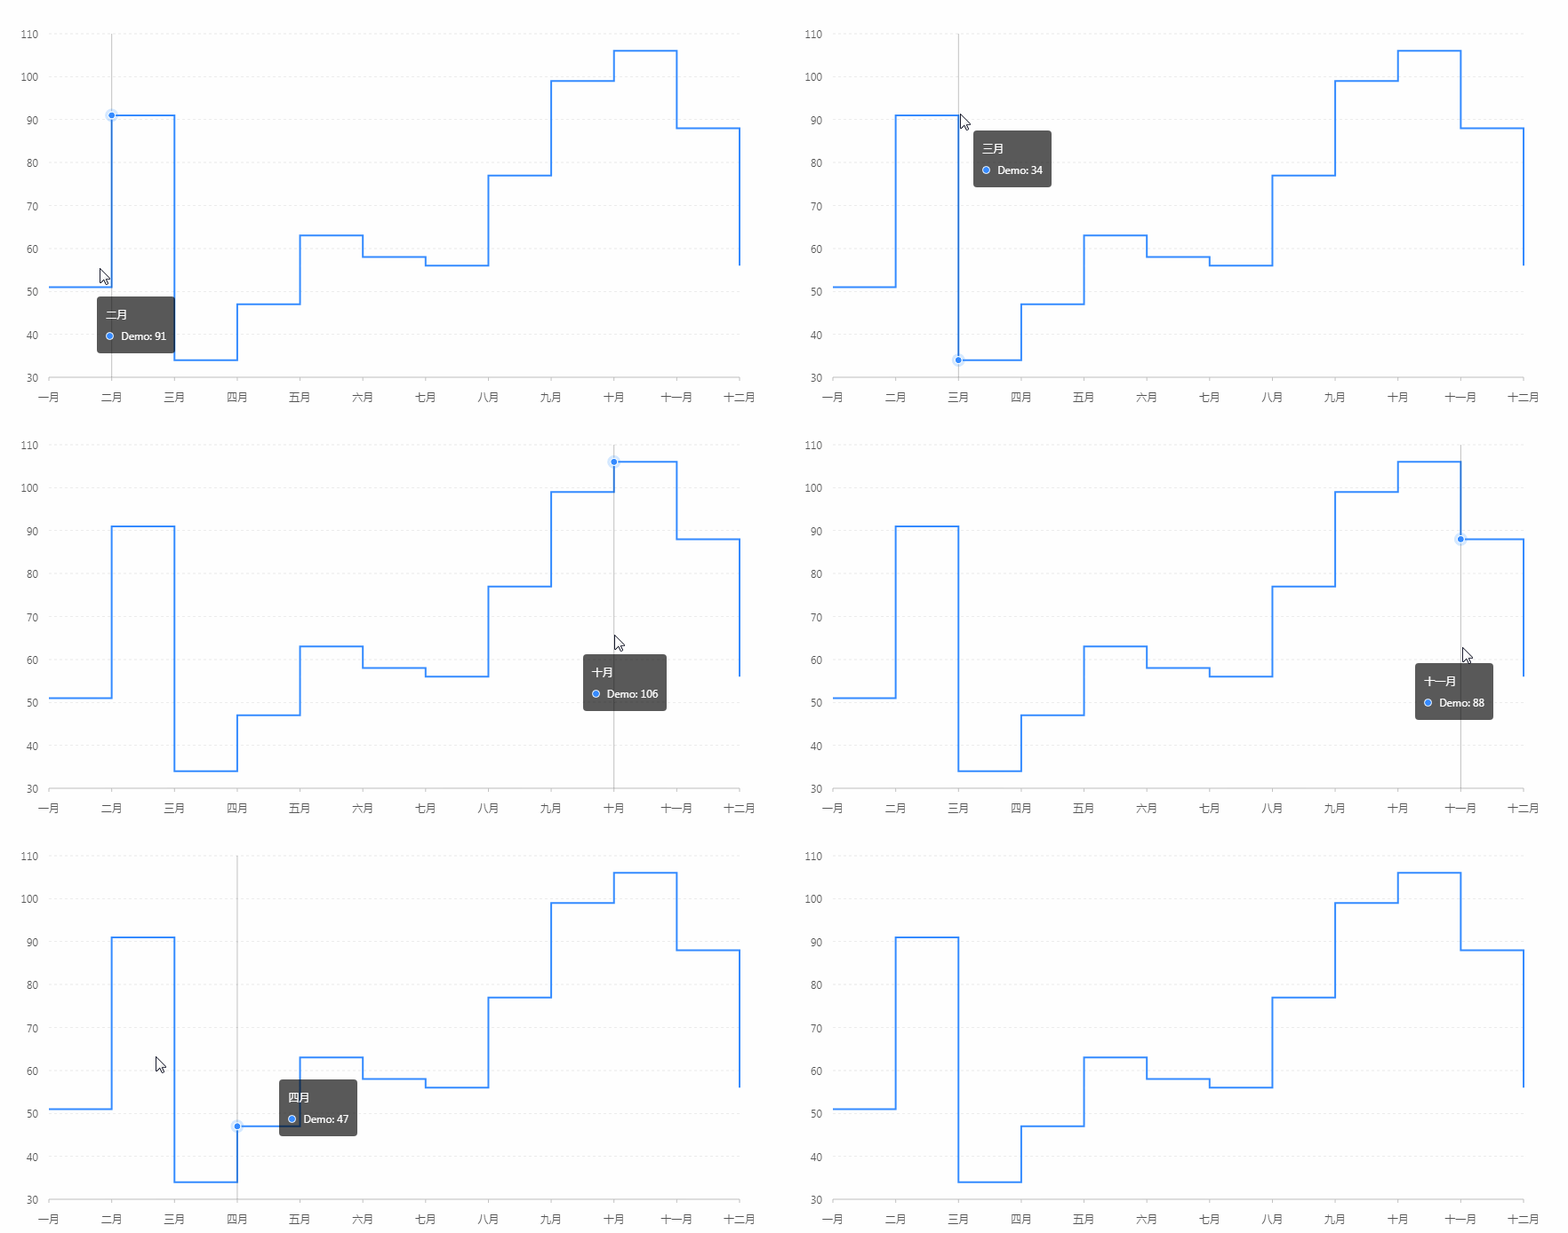
演示效果

1. 知识点A - 如何引入js文件
<script src="./js/g2.min.js"></script>
<script src="./js/data-set.min.js"></script>
使用内嵌对js文件进行引入,用于后期图表使用。
2. 知识点B - 如何定义容器
<div id="jietitu"></div>
使用div定义容器,用于展示图表。容器名:jietitu。
3. 知识点C - 如何定义数据
  const data = [
    { yf: '一月', Demo: 51 },
    { yf: '二月', Demo: 91 },
    { yf: '三月', Demo: 34 },
    { yf: '四月', Demo: 47 },
    { yf: '五月', Demo: 63 },
    { yf: '六月', Demo: 58 },
    { yf: '七月', Demo: 56 },
    { yf: '八月', Demo: 77 },
    { yf: '九月', Demo: 99 },
    { yf: '十月', Demo: 106 },
    { yf: '十一月', Demo: 88 },
    { yf: '十二月', Demo: 56 }
  ];
- data:使用数组形式定义数据。
- 格式:{名称:'对应值',名称:对应值}
4. 知识点D - 如何引用数据
  const chart = new G2.Chart({
    container: 'jietitu',
    forceFit: true,
    height: window.innerHeight
  });
  chart.source(data, {
    yf: {
      range: [ 0, 1 ]
    }
  });
- container:定于数据从jietitu数组取值。
- forceFit: 定义图表的宽度自适应开关,默认为 false,设置为 true 时表示自动取 dom(实例容器)的宽度。
- height: 定义图表高度。
- source:定义为chart装载数据,返回chart对象。
- range:定义输出数据的范围,默认[ 0, 1 ],格式为 [ min, max ],min 和 max 均为 0 至 1 范围的数据。
5. 知识点E - 如何渲染图表
  chart.line().position('yf*Demo').shape('hv');
  chart.render();
- line:定义线图组件。
- position:定义将数据值映射到图形的位置上的方法。
格式:position('fieldA*fieldB')使用 * 连接,position 属性会对多个字段进行数据的映射。 - render:图表绘制的最后一步,用于将图表渲染至画布。
完整代码
<html lang="en">
<head>
    <meta charset="UTF-8">
    <meta name="viewport" content="width=device-width,height=device-height">
    <title>阶梯折线图</title>
</head>
<body>
<div id="jietitu"></div>
<script src="./js/g2.min.js"></script>
<script src="./js/data-set.min.js"></script>
<script>
  const data = [
    { yf: '一月', Demo: 51 },
    { yf: '二月', Demo: 91 },
    { yf: '三月', Demo: 34 },
    { yf: '四月', Demo: 47 },
    { yf: '五月', Demo: 63 },
    { yf: '六月', Demo: 58 },
    { yf: '七月', Demo: 56 },
    { yf: '八月', Demo: 77 },
    { yf: '九月', Demo: 99 },
    { yf: '十月', Demo: 106 },
    { yf: '十一月', Demo: 88 },
    { yf: '十二月', Demo: 56 }
  ];
  const chart = new G2.Chart({
    container: 'jietitu',
    forceFit: true,
    height: window.innerHeight
  });
  chart.source(data, {
    yf: {
      range: [ 0, 1 ]
    }
  });
  chart.line().position('yf*Demo').shape('hv');
  chart.render();
</script>
</body>
</html>
最终效果

系列课程
我在乌托邦上完成20多个关于eCharts的教程。
I have completed 20+ tutorials about echarts.
如果您喜欢我的教程,可以在我的个人档案页面,获取更多信息。
If you like my tutorial , You can check out your profile for more such tutorials.
您可以使用zqz-tutorial标签快速查看我发布的所有教程
You can use the "zqz-tutorial" tag to see all the tutorials I've posted.
Thank you for the contribution. It has been approved.
You can contact us on Discord.
[utopian-moderator]
Downvoting a post can decrease pending rewards and make it less visible. Common reasons:
Submit
ok~
Next contribution I will delete this part.
Thank you very much~
Downvoting a post can decrease pending rewards and make it less visible. Common reasons:
Submit
Copied from https://antv.alipay.com/zh-cn/g2/3.x/demo/line/step.html
You can contact us on Discord.
[utopian-moderator]
Downvoting a post can decrease pending rewards and make it less visible. Common reasons:
Submit
Good see my post with news on crypto @trzynasty1388
Downvoting a post can decrease pending rewards and make it less visible. Common reasons:
Submit
Hey @hui.zhao I am @utopian-io. I have just upvoted you!
Achievements
Suggestions
Get Noticed!
Community-Driven Witness!
I am the first and only Steem Community-Driven Witness. Participate on Discord. Lets GROW TOGETHER!
Up-vote this comment to grow my power and help Open Source contributions like this one. Want to chat? Join me on Discord https://discord.gg/Pc8HG9x
Downvoting a post can decrease pending rewards and make it less visible. Common reasons:
Submit