Summary:
G2 is a set of graphically-based graphical syntax that is data-driven and highly user-friendly and extensible, allowing users to build a wide variety of interactive statistics without having to worry about detailed implementation details chart.
G2 是一套基于可视化编码的图形语法,以数据驱动,具有高度的易用性和扩展性,用户无需关注各种繁琐的实现细节,一条语句即可构建出各种各样的可交互的统计图表。
您将从这个教程中学到什么
- 如何引入js文件
- 如何定义容器
- 如何定义数据
- 如何定义图例
- 如何引用数据
- 如何定义坐标轴
- 如何渲染图表
学习此教程的必备条件
教程难度
- 容易
教程内容
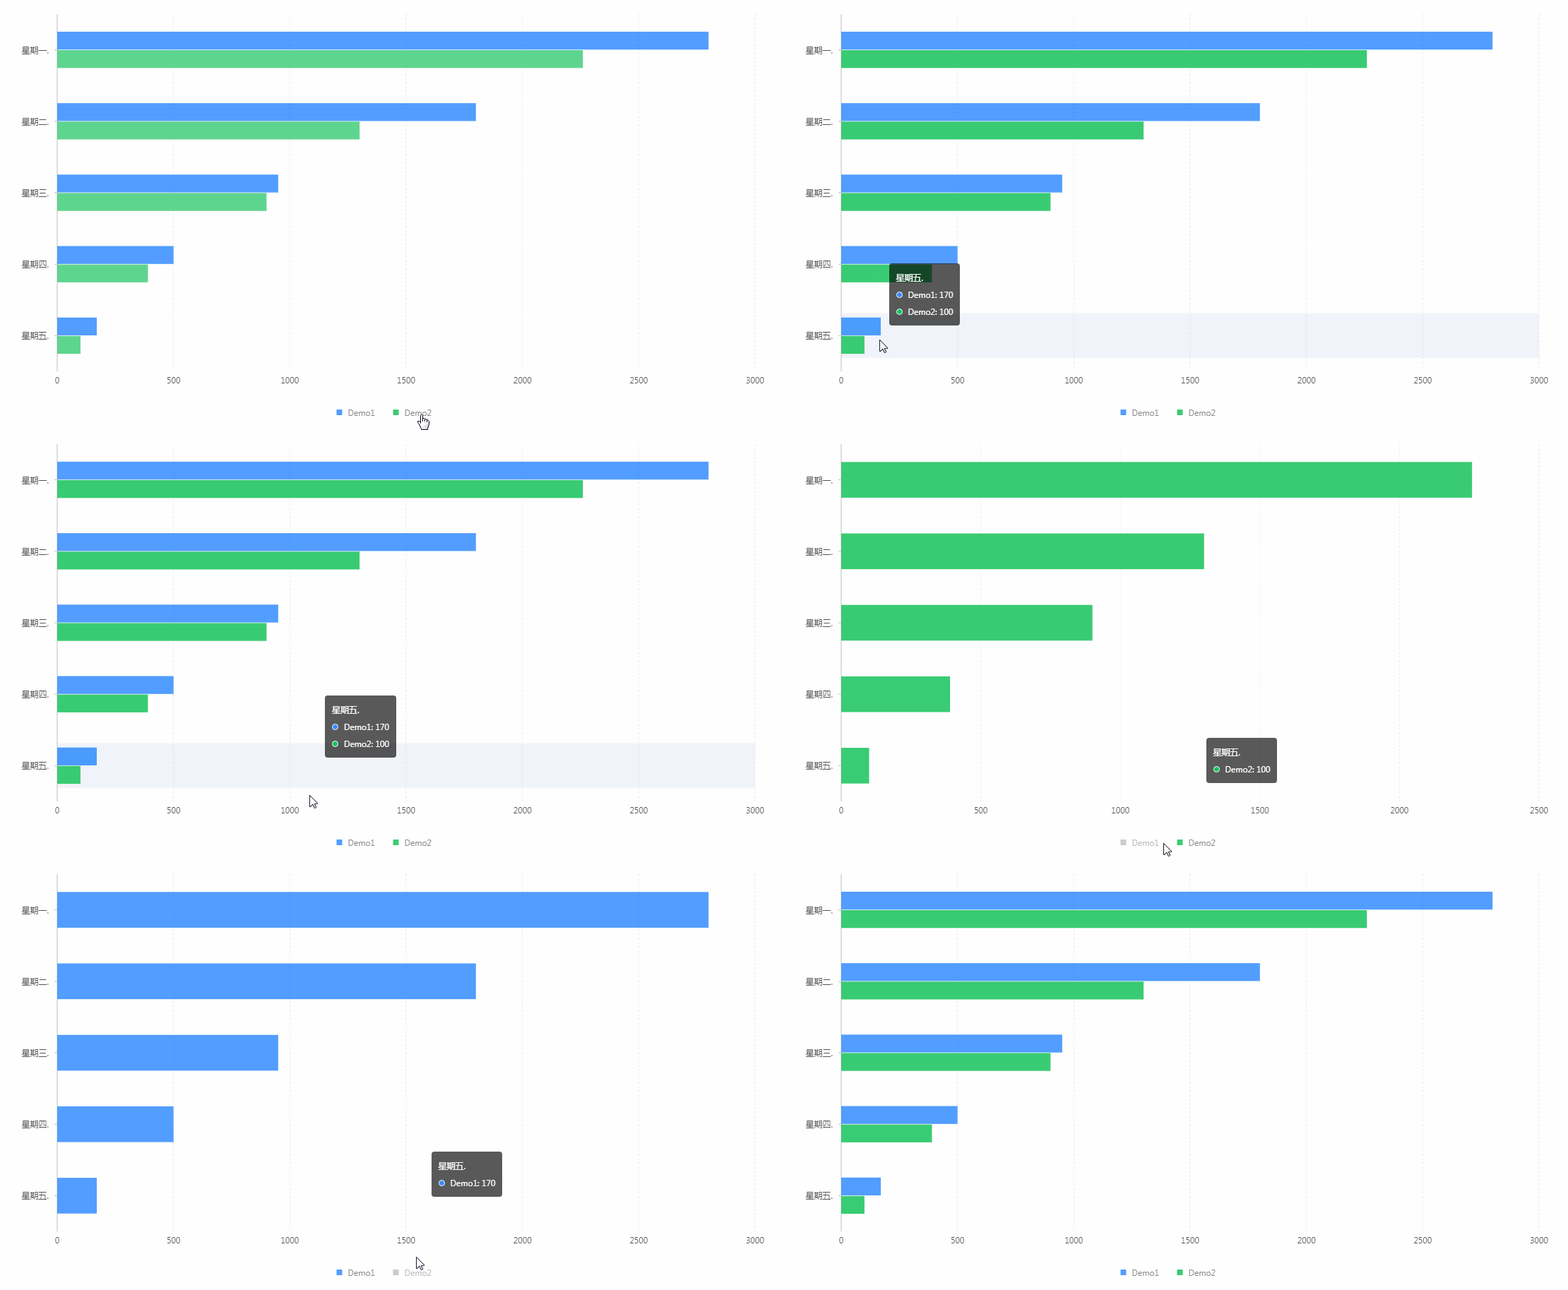
演示效果

1. 知识点A - 如何引入js文件
<script src="https://gw.alipayobjects.com/os/antv/assets/g2/3.0.4-beta.2/g2.min.js"></script>
<script src="https://gw.alipayobjects.com/os/antv/assets/data-set/0.8.3/data-set.min.js"></script>
使用内嵌对js文件进行引入,用于后期图表使用。
2. 知识点B - 如何定义容器
<div id="groupbar"></div>
使用定义容器,用于展示图表。容器名:groupbar。
3. 知识点C - 如何定义数据
  const data = [
    { label: '星期一.', Demo1: 2800, Demo2: 2260 },
    { label: '星期二.', Demo1: 1800, Demo2: 1300 },
    { label: '星期三.', Demo1: 950, Demo2: 900 },
    { label: '星期四.', Demo1: 500, Demo2: 390 },
    { label: '星期五.', Demo1: 170, Demo2: 100 },
  ];
- data:使用数组形式定义数据。
- 格式:{名称:'Y轴对应值',数据值:对应值,数据值:对应值}
4. 知识点D - 如何定义图例
  const ds = new DataSet();
  const dv = ds.createView().source(data);
  dv.transform({
    type: 'fold',
    fields: [ 'Demo1', 'Demo2' ],
    key: 'type',
    value: 'value',
  });
- createView:创建并返回一个数据视图实例。
- type:属性为fold,以指定字段集为key,展开数据。
- fields:定义图例名称。
- key:定义key值。
- value:定义value值。
5. 知识点E - 如何引用数据
  const chart = new G2.Chart({
    container: 'groupbar',
    forceFit: true,
    height: window.innerHeight
  });
  chart.source(dv);
- container:定于数据从groupbar数组取值。
- forceFit: 定义图表的宽度自适应开关,默认为 false,设置为 true 时表示自动取 dom(实例容器)的宽度。
- height: 定义图表高度。
- source:定义为chart装载数据,返回chart对象。
6. 知识点F - 如何定义坐标轴
  chart.axis('value', {
    position: 'right'
  });
  chart.axis('label', {
    label: {
      offset: 12
    }
  });
- axis:坐标轴配置,该方法返回 chart 对象。
- position:定义对齐方式。
- offset:定义坐标轴文本 label 距离坐标轴线的距离
7. 知识点G - 如何渲染图表
  chart.coord().transpose().scale(1, -1);
  chart.interval().position('label*value').color('type').adjust([{
    type: 'dodge',
    marginRatio: 1 / 32
  }]);
  chart.render();
- coord:设置坐标系类型,同时允许进行各种坐标系变换,默认为笛卡尔坐标系。
- interval:创建柱图,返回一个 geom 对象
- position:定义将数据值映射到图形的位置上的方法。
格式:position('fieldAfieldB')*使用 * 连接,position 属性会对多个字段进行数据的映射。 - type:属性为dodge,表示使用分组显示。
- marginRatio:用于调整分组中各个柱子的间距。
- render:图表绘制的最后一步,用于将图表渲染至画布。
完整代码
<html lang="en">
<head>
    <meta charset="UTF-8">
    <title>分组条形图</title>
</head>
<body>
<div id="groupbar"></div>
<script src="https://gw.alipayobjects.com/os/antv/assets/g2/3.0.4-beta.2/g2.min.js"></script>
<script src="https://gw.alipayobjects.com/os/antv/assets/data-set/0.8.3/data-set.min.js"></script>
<script>
  const data = [
    { label: '星期一.', Demo1: 2800, Demo2: 2260 },
    { label: '星期二.', Demo1: 1800, Demo2: 1300 },
    { label: '星期三.', Demo1: 950, Demo2: 900 },
    { label: '星期四.', Demo1: 500, Demo2: 390 },
    { label: '星期五.', Demo1: 170, Demo2: 100 },
  ];
  const ds = new DataSet();
  const dv = ds.createView().source(data);
  dv.transform({
    type: 'fold',
    fields: [ 'Demo1', 'Demo2' ],
    key: 'type',
    value: 'value',
  });
  const chart = new G2.Chart({
    container: 'groupbar',
    forceFit: true,
    height: window.innerHeight
  });
  chart.source(dv);
  chart.axis('value', {
    position: 'right'
  });
  chart.axis('label', {
    label: {
      offset: 12
    }
  });
  chart.coord().transpose().scale(1, -1);
  chart.interval().position('label*value').color('type').adjust([{
    type: 'dodge',
    marginRatio: 1 / 32
  }]);
  chart.render();
</script>
</body>
</html>
最终效果

系列课程
如果您喜欢我的教程,可以在我的个人档案页面,获取更多信息。
您可以使用zqz-tutorial标签快速查看我发布的所有教程。
Posted on Utopian.io - Rewarding Open Source Contributors
Thank you for the contribution. It has been approved.
You can contact us on Discord.
[utopian-moderator]
Downvoting a post can decrease pending rewards and make it less visible. Common reasons:
Submit
Thank you very much~
Downvoting a post can decrease pending rewards and make it less visible. Common reasons:
Submit
The contribution cannot be approved because it does not follow the Utopian Rules.
Taken from https://antv.alipay.com/zh-cn/g2/3.x/demo/bar/grouped.html
You can contact us on Discord.
[utopian-moderator]
Downvoting a post can decrease pending rewards and make it less visible. Common reasons:
Submit