Preface
In this tutorial, I will go over one way to create a node-tree type graph considering Chart.js does not have such a default. Here is the previous tutorial on how to plot points by clicking on the graph:
What Will You Learn?
- How to create your own default chart type in Chart.js
- How to build a custom draw function that can either replace or supplement existing functionality.
- Basics surrounding function finding and rebuilding within the Chart.js library.
Requirements
In order to better learn and understand this library, I would recommend as well as be using a non-minified version to easily look up functions and read through. The link I am currently using is:
<script src="https://cdnjs.cloudflare.com/ajax/libs/Chart.js/2.7.2/Chart.js"></script>
- The Chart.js library
- A folder or directory with index.html and main.js files.
- A browser, this tutorial tested on Firefox, Edge, Android Firefox, and Chrome.
- A text editor of your choice (I use Brackets).
Difficulty
- Intermediate
Tutorial Contents
One of my personal favorite chart types, the node-tree, is not included as a default in Chart.js. I was fairly surprised especially because of how robust the coordinate system seems. There are, of course, many ways to create a node-tree in Chart.js but I will try to go over this particular implementation for its foundational merit and simplicity. It essentially involves being able to identify individual points and attribute other points as children to those points. Then draw arbitrary canvas lines between them.
To begin, simply create an html file and add the following:
index.html
<!DOCTYPE html>
<html>

    <head>

        <meta charset="utf-8">
        <meta name="viewport" content="width=device-width,initial-scale=1">
        <script src="https://cdnjs.cloudflare.com/ajax/libs/Chart.js/2.7.2/Chart.js"></script>
        <script src="main.js"></script>

    </head>

    <body>

        <div style="width:75%; height:auto; margin:auto; border-style: solid;">
        <canvas id="chart" width="9" height="5"></canvas>
        </div>

    </body>

</html>
My canvas element sizing and position conventions are explained in the previous tutorial - the div provides positioning and window-based width while the canvas width/height ratio is used to determine the height from the dynamic width.
Setup and Info
Next we can begin working in the main.js file which we can use to dig into some Chart.js code by logging functions in the debugger console of a browser. I will be using Firefox with the dark theme. Before we need to do that though, we can use the native functionality to extend a graph type of our own based on an existing one. Here is the first part of the main.js with some varying options:
main.js
function regCustomChart() {

    Chart.defaults.nodeTree = Chart.defaults.scatter; // Done to avoid bugs and establish basic defaults

    var ndGraphtype = Chart.controllers.scatter.extend();

    Chart.controllers.nodeTree = ndGraphtype;

}
Alternatively, because these are objects, you could simply create your own object called "nodeTree" by referencing it where it does not exist which creates a key within Chart.controllers. This is what is done in the official docs but you could take it slightly further if you only want to modify some prototype. You could simply directly copy a controller into your new key like how it's done for the defaults at the top without .extend(). Just for clarification because this can trip some people up, if you type:
Chart.controllers.nodeTree = Chart.controllers.scatter;
You are automatically creating a new key(reference) in the Chart.controllers object if the Chart.controllers object exists but your key at the end does not. Then when you set it equal to another object.key reference, it becomes equal to whatever function/object/integer is contained there.
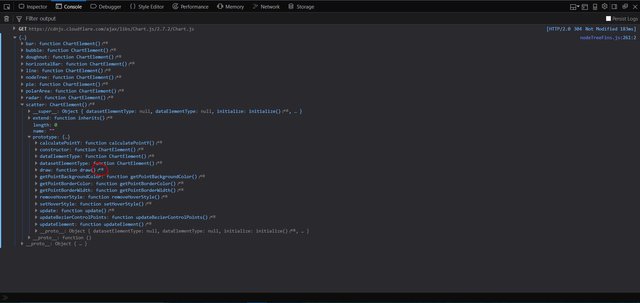
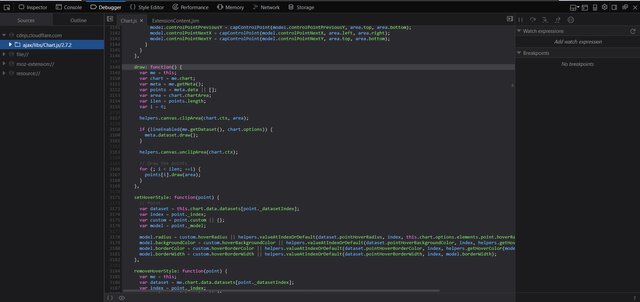
Anyway, I will be using the native .extend() function because it is simple and avoids us altering prototypes even if it is that of our own created chart type. To get a list of functions you can replace or extend, simply run console.log(Chart.controllers); which prints all the current default chart types. To access this, run your html file in a browser, right click anywhere on the page, and press "Inspect Element" and go to the console tab. Click the chart type you want to jump off from and open the prototype object where you'll get a list of functions you can extend. Click on the little jump link to see the function defined in the actual Chart.js library. If you are using a non-minified version like the one I listed at the top, the definition should be easy to read:


Correct me if I am wrong, but I believe that the prototype functions are used for that particular graph type while the _super_ functions are references to generic functions which can be called when needed, are not used by every chart type, and should not be changed. Also, if you want to find how anything else works in Chart.js, oftentimes it is as simple as either logging the function's name without "()" or looking nearby - if the function is invoked without being referenced within an object. All that said, lets look at how to add to the functionality of a proto function with extend:
main.js
function regCustomChart() {

    Chart.defaults.nodeTree = Chart.defaults.scatter;

    var ndGraphtype = Chart.controllers.scatter.extend({
        draw: function(ease) {
                Chart.controllers.scatter.prototype.draw.call(this, ease);

                var ctx = this.chart.ctx;

                Chart.helpers.canvas.clipArea(ctx, area);
                    ctx.beginPath();
                    ctx.moveTo(some_x_value, some_y_value);
                    ctx.lineTo(some_x_value, some_y_value);
                    ctx.stroke();
                Chart.helpers.canvas.unclipArea(ctx);
        }
    });
    Chart.controllers.nodeTree = ndGraphtype;
}
Based on the docs, you cannot truly extend prototype functionality meaning you have to call the original chart type's draw function in the newly created chart type, then add stuff after. In the above example, you can draw arbitrary lines after the lines and points are drawn by the original draw function. Important to note - anytime you see ctx. both in Chart.js source and main.js files, it usually means document.getElementById('chart').getContext('2d'); with whatever canvas id you set in the html file. This means that the function used is likely part of the official html5 canvas functions so you can reference the various docs for those.
Recreating the Draw Functions
With the simple investigative work in the debugger and knowing that prototype functions seem to be overwritten anyway, lets rebuild some draw functions. Now, in Chart.js there are three major draw functions. The first high tier one simply calls the other two and for the "scatter" type, here it is as in the source:
draw: function() {
            var me = this;
            var chart = me.chart;
            var meta = me.getMeta();
            var points = meta.data || [];
            var area = chart.chartArea;
            var ilen = points.length;
            var i = 0;

            helpers.canvas.clipArea(chart.ctx, area);

            if (lineEnabled(me.getDataset(), chart.options)) {
                meta.dataset.draw();
            }

            helpers.canvas.unclipArea(chart.ctx);

            // Draw the points
            for (; i < ilen; ++i) {
                points[i].draw(area);
            }
        }
If you try to use this exactly in the extend parameters though, it will probably not work for two reasons. One is the absence of the lineEnabled() function and the other is the helper function. Anytime you want to use a Chart.js helper function which are all listed after console logging Chart.helpers, you must simply precede it with "Chart." As for lineEnabled(), digging a tiny bit reveals that it is the equivalent to:
if (Chart.helpers.valueOrDefault(me.getDataset().showLine, chart.options.showLines)) {
    meta.dataset.draw();
}
As you may notice, this is not where the actual lines are getting draw which is where we want to be, so after digging some more, this is the actual draw lines function used for line and scatter types: Found at console.log(Chart.elements.Line.prototype.draw); this draw is specifically for lines between points, so this is what we need to recreate or at least base our new function off of. We can create our own to use in the high tier, but to show off interaction between different methods I'll combine the high tier with the code needed to draw lines.
Before that though, we again need to recreate the style code because some references will not work outside the library. This is what handles stroke thickness and colors and such. Here is the converted function stripped of actual line drawing capabilities:
draw: function(ease) {
            var chart = this.chart,
                meta = this.getMeta(),
                purePoints = this._data,
                metaPoints = meta.data || [];

            if (meta.dataset._view) {
                var area = chart.chartArea,
                    datasetOps = meta.dataset._view,
                    globalOptionLineElements = Chart.defaults.global.elements.line,
                    ctx = this.chart.ctx;

                if (meta.dataset._loop && metaPoints.length) {
                    metaPoints.push(metaPoints[0]);
                }

                ctx.save();

                // Stroke Line Options
                ctx.lineCap = datasetOps.borderCapStyle || globalOptionLineElements.borderCapStyle;
                if (ctx.setLineDash) { // IE 9 and 10 do not support line dash
                    ctx.setLineDash(datasetOps.borderDash || globalOptionLineElements.borderDash);
                }
                ctx.lineDashOffset = datasetOps.borderDashOffset || globalOptionLineElements.borderDashOffset;
                ctx.lineJoin = datasetOps.borderJoinStyle || globalOptionLineElements.borderJoinStyle;
                ctx.lineWidth = datasetOps.borderWidth || globalOptionLineElements.borderWidth;
                ctx.strokeStyle = datasetOps.borderColor || Chart.defaults.global.defaultColor;

                ctx.restore();
            }
            // Just Draw the points
            for (var i = 0; i < metaPoints.length; i++) {
                metaPoints[i].draw(area);
            }
        }
Besides just replacing references which are easy to find, one of the more important things to note here is the ctx.save() and ctx.restore() which I believe creates a modifiable instance of the canvas styling options after save() and restores the style back to what it was right before save() upon calling restore(). Our line drawing must be between these, but since the point drawing function has its own, it must be outside of them.
Node-tree Custom Lines
Finally, after figuring all that out we can create our custom line drawing functionality which will connect points based on their children and not on array index. Here is what I came up with:
main.js
function regCustomChart() {

    Chart.defaults.nodeTree = Chart.defaults.scatter;

    var ndGraphtype = Chart.controllers.scatter.extend({
        draw: function(ease) {
            var chart = this.chart,
                meta = this.getMeta(),
                purePoints = this._data,
                metaPoints = meta.data || [];

            if (meta.dataset._view) {
                var area = chart.chartArea,
                    datasetOps = meta.dataset._view,
                    index = 0,
                    suppIndex = 0,
                    subIndex = 0,
                    globalOptionLineElements = Chart.defaults.global.elements.line,
                    ctx = this.chart.ctx;

                Chart.helpers.canvas.clipArea(ctx, area);

                if (meta.dataset._loop && metaPoints.length) {
                    metaPoints.push(metaPoints[0]);
                }

                ctx.save();

                // Stroke Line Options
                ctx.lineCap = datasetOps.borderCapStyle || globalOptionLineElements.borderCapStyle;
                if (ctx.setLineDash) { // IE 9 and 10 do not support line dash
                    ctx.setLineDash(datasetOps.borderDash || globalOptionLineElements.borderDash);
                }
                ctx.lineDashOffset = datasetOps.borderDashOffset || globalOptionLineElements.borderDashOffset;
                ctx.lineJoin = datasetOps.borderJoinStyle || globalOptionLineElements.borderJoinStyle;
                ctx.lineWidth = datasetOps.borderWidth || globalOptionLineElements.borderWidth;
                ctx.strokeStyle = datasetOps.borderColor || Chart.defaults.global.defaultColor;

                // Draw lines connecting points
                for (index = 0; index < purePoints.length; index++) {
                    if (purePoints[index] && Array.isArray(purePoints[index].children)) {
                        //for (var child of purePoints[index].children) { // or
                        for (suppIndex = 0; suppIndex < purePoints[index].children.length; suppIndex++) {
                            ctx.beginPath();
                            ctx.moveTo(metaPoints[index]._view.x, metaPoints[index]._view.y);
                            for (subIndex = 0; subIndex < purePoints.length; subIndex++) {
                                //if (purePoints[subIndex] && purePoints[subIndex].id == child) { // or
                                if (purePoints[subIndex] && purePoints[subIndex].id == purePoints[index].children[suppIndex]) {
                                    ctx.lineTo(metaPoints[subIndex]._view.x, metaPoints[subIndex]._view.y);
                                    ctx.stroke();
                                }
                            }
                        }
                    }
                }
                ctx.restore();
                Chart.helpers.canvas.unclipArea(ctx);
            }

            // Draw the points
            for (var i = 0; i < metaPoints.length; i++) {
                metaPoints[i].draw(area);
            }
        }
    });

    Chart.controllers.nodeTree = ndGraphtype;
}

regCustomChart();
So here it is, this will be able to draw lines only within the graph space by wrapping the line code in Chart.helpers.canvas.clipArea(ctx, area); and Chart.helpers.canvas.unclipArea(ctx);. Otherwise, I am simply starting a line by moving to the main point for every child it has, then checking the children array against all the points in the purePoints array after which I draw the actual line. The most notable difference between my drawing and the official one, is my use of ctx.lineTo() vs Chart.helpers.canvas.lineTo(ctx, previous._view, current._view, false);. The Chart.js lineTo helper handles curves and multi-point lines, but is not useful for this simple node network. I will hopefully demonstrate soon how to rebuild that one as well. As for usable values in ctx.moveTo(x, y) and ctx.lineTo(x, y), the native metadata luckily has those values ready to plug in. Since the metadata and pure data arrays are derived from each other, we can use the same for loop to run through them simultaneously.
Onto actual point creation in the standard chart initialization. Now I know what you are thinking, what children array? This is where that purePoints variable declared at the top comes in very handy. Since the native metadata does not include custom information, we have to get the raw dataset data and reference the pure information which is used to create the chart, alongside the metadata. That means that all we need to do now is create a chart with the type "nodeTree" and make sure each point also has a children:array key:value pair and an id:string key:value pair. Once we set those in a random graph, lines will connect points which are listed as children within themselves based on arbitrary ids. Here is a chart set-up which works with our new draw function.
main.js
window.addEventListener('DOMContentLoaded', function () {

    drawTester();

}, false);

function randomColor(alpha) {
    return String('rgba(' + Math.round(Math.random() * 255) + ',' + Math.round(Math.random() * 255) + ',' + Math.round(Math.random() * 255) + ',' + alpha + ')');
}

function drawTester() {
    var ctx = document.getElementById('chart').getContext('2d');

    globalNodeChtRef = new Chart(ctx, {
        type: 'nodeTree',
        data: {
            datasets: [
                {
                    borderColor: randomColor(0.8),
                    backgroundColor: randomColor(0.7),
                    pointBorderColor: randomColor(1),
                    data: [
                        {
                            x: -1,
                            y: 5,
                            id: 'a',
                            children: ['b', 'c', 'd']
                        },
                        {
                            x: 2,
                            y: 7,
                            id: 'b',
                            children: []
                        },
                        {
                            x: 3,
                            y: 4,
                            id: 'c',
                            children: []
                        },
                        null,
                        {
                            x: 2.5,
                            y: 2,
                            id: 'd',
                            children: []
                        },
                        {
                            x: 6,
                            y: 5.8,
                            id: 'e',
                            children: ['a', 'd']
                        }
                    ],
                    showLine: true,
                    fill: false,
                    lineTension: 0.4
                }
            ]
        },
        options: {
            title: {
                display: true,
                text: "Chart.js Nodes",
                lineHeight: 1
            },
            scales: {
                xAxes: [{
                    type: "linear",
                    display: true,
                    scaleLabel: {
                        display: true,
                        labelString: 'X-Axis'
                    }
                }, ],
                yAxes: [{
                    display: true,
                    scaleLabel: {
                        display: true,
                        labelString: 'Y-Axis'
                    }
                }]
            },
            responsive: true,
            maintainAspectRatio: true
        }
    });
}
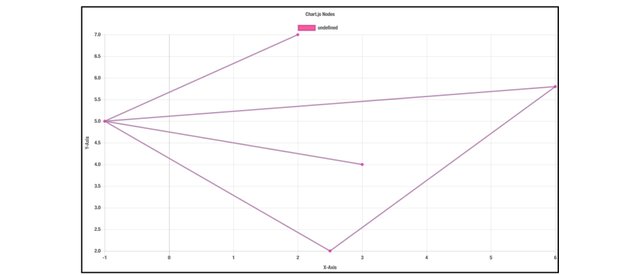
The only things I have added are the arbitrary key:value pairs which associate with my draw function. The "children" key contains an array with "id"s of other points and that is it. With the above added to main.js, alongside our chart-type creation function which does not need to wait for the DOM, you should see this graph upon opening the html file in a browser:

As you can see, each point connects to whichever point was in its children array. With creative spacing, some very interesting graphs could be made. The connecting lines are individually drawn though, so all of them will be straight but that can be amended later on.
This will be everything for this tutorial since it establishes a solid jumping off point for more advanced implementations of node trees in Chart.js. In future tutorials, I will try to create fancier node networks utilizing curves and spacing using this as a base. I tried to account for several options such as making sure it runs even if null values are in the data, or if the data does not have children or an id, so pls tell me if you encounter problems. Line tension is kept in because, while it does not do anything now, I want to use it soon for multi-node lines. Anyways, hope you enjoyed and learned something useful about Chart.js from this tutorial, and as always, have a good one!
Posted on Utopian.io - Rewarding Open Source Contributors
Thank you for the contribution. It has been approved.
You can contact us on Discord.
[utopian-moderator]
Downvoting a post can decrease pending rewards and make it less visible. Common reasons:
Submit
Hey @loshcat I am @utopian-io. I have just upvoted you!
Achievements
Community-Driven Witness!
I am the first and only Steem Community-Driven Witness. Participate on Discord. Lets GROW TOGETHER!
Up-vote this comment to grow my power and help Open Source contributions like this one. Want to chat? Join me on Discord https://discord.gg/Pc8HG9x
Downvoting a post can decrease pending rewards and make it less visible. Common reasons:
Submit
Congratulations!,@loshcatYou just got my free but small upvote
I invite you to the @eoscafe community [https://discord.gg/wdUnCdE]
Downvoting a post can decrease pending rewards and make it less visible. Common reasons:
Submit