Hi, there 👋

future is of Artificial Intelligence. AI has already started being an integral part of human society. From the smartphones, we use to watch AI recommended youtube videos to the car we drive to our offices most of the things(gadget) surrounding us is probably using AI. So me being a programmer, I thought why not make a small tutorial you guys can try that use AI or more specifically Machine Learning as far as this article is concerned. Before I begin this tutorial I would like to remind you that for this tutorial, you need to have basic knowledge of python programming language and I assure you will be very surprised to see how easy it is to build a basic machine learning program in python. So what are we waiting for let's get started my friends, shall we? 😉
🔹Software Requirements🔹
🔹Software Requirements🔹🔹 Python 3
🔹 PIP python get-pip.py
🔹Our Data🔹
🔹Our Data🔹
For this tutorial we will need to get user's follower list which we can either get directly from the steem blockchain by preparing some separate code but, I don't want to get into the details of querying the steem blockchain with python as that will be a whole new tutorial itself, so we will directly pick the data from this site with a little bit of webscraping.
This site doesn't return data prior to 1st Jan 2018 but that should be much of a problem most of the time and we will start numbering days from 1st Jan 2018. That is to say as 1st Jan will be Day 1, 2nd Jan will be Day 2 and so on.. First of all we will see how our data looks on graph. In order to do so we will do a scatter plot of our data points and for that we need the Matplotlib library which you can install by executing the below line on your cmd/terminal.
pip install matplotlib🔹Code to plot the data as scatter plot🔹#importing matplotlib library
import matplotlib.pyplot as plot
days_arr = [[5], [10], [15], [20], [25], [30], [35], [40], [45], [50], [55], [60], [65], [70], [75], [80], [85], [90], [95], [100], [105], [110], [115], [120], [125], [130], [135], [140], [145], [150], [155], [160], [165], [170], [175], [180], [185], [190], [195], [200], [205], [210], [215], [220], [225], [230], [235], [240], [245], [250]]
# followers array is an array of the cumulative sum of followers
followers = [286, 416, 709, 952, 1231, 1554, 1777, 2024, 2299, 2463, 2644, 2803, 2986, 3099, 3312, 3410, 3577, 3736, 3854, 4020, 4118, 4258, 4392, 4474, 4580, 4699, 4824, 5018, 5243, 5351, 5558, 5744, 5815, 5872, 6006, 6088, 6244, 6379, 6469, 6559, 6656, 6753, 6830, 6896, 6959, 7056, 7124, 7150, 7208, 7372]
plot.scatter(days, followers, color='red', s=3, alpha=1.0)
# X-axis label
plot.xlabel('Day')
# Y-axis label
plot.ylabel('Steemit Followers')
🔹Output🔹
🔹Algorithm🔹
🔹Algorithm🔹
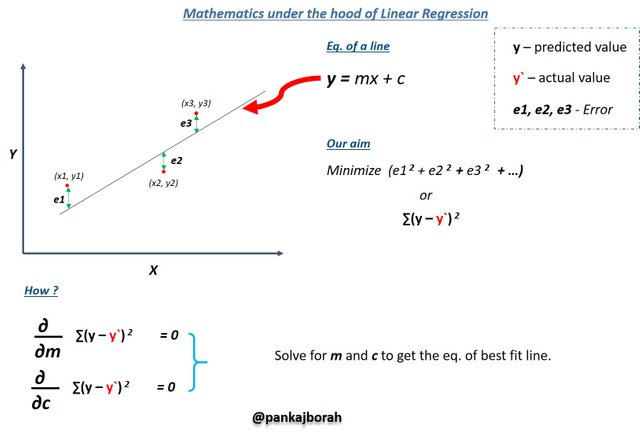
🔹 Linear Regression - Since we can visualize form the scatter plot above that the data is somewhat linear, so we for the sake of this tutorial we will use Linear Regression algorithm to find a line that passes through some of the points on the plot such that the loss function is minimum or to say line that best fits all the data points such that error is minimum.

To apply the algorithm to our data we will use a popular machine learning python library called Scikit Learn. To install the library copy the below command onto your cmd 💻 and hit enter.
pip install scikit-learn🔹Final code to find the line of best fit🔹
#importing the linear model from scikit learn

from sklearn import linear_model

#importing matplotlib library

import matplotlib.pyplot as plot

import numpy as np

days = [[5], [10], [15], [20], [25], [30], [35], [40], [45], [50], [55], [60], [65], [70], [75], [80], [85], [90], [95], [100], [105], [110], [115], [120], [125], [130], [135], [140], [145], [150], [155], [160], [165], [170], [175], [180], [185], [190], [195], [200], [205], [210], [215], [220], [225], [230], [235], [240], [245], [250]]

followers = [286, 416, 709, 952, 1231, 1554, 1777, 2024, 2299, 2463, 2644, 2803, 2986, 3099, 3312, 3410, 3577, 3736, 3854, 4020, 4118, 4258, 4392, 4474, 4580, 4699, 4824, 5018, 5243, 5351, 5558, 5744, 5815, 5872, 6006, 6088, 6244, 6379, 6469, 6559, 6656, 6753, 6830, 6896, 6959, 7056, 7124, 7150, 7208, 7372]

plot.scatter(days, followers, color='red', s=3, alpha=1.0)
plot.xlabel('Day')
plot.ylabel('Steemit Followers')

linear_regression_classifier = linear_model.LinearRegression()
# fit a line such that error is minimum
linear_regression_classifier = linear_regression_classifier.fit(days, followers)

# predict the no. of followers on Day 23, Day 301 and Day 323

model_prediction = linear_regression_classifier.predict([[23], [301], [323]])

#plot the line of best fit

plot.plot([[23], [301], [323]], model_prediction, color='black', linewidth=1)

# print the predicted result on terminal

print(np.floor(model_prediction))

#Output the plot

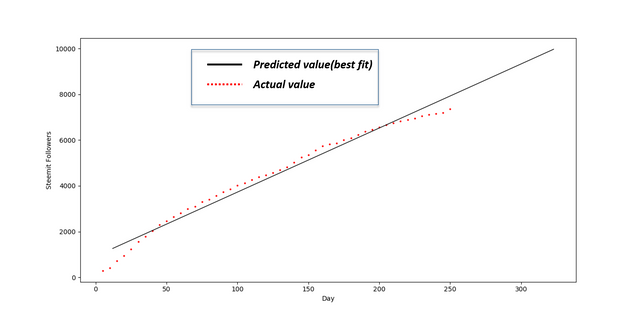
plot.show()
🔹Output🔹💻Terminal output - [ 1261. 9357. 9974.] which is nothing but predicted no. of followers on Day 23, Day 301 and Day 323 respectively.

⚠️Note - This algorithm performs best only for linear data, if your data seems to be non-linear than it won't perform good. In that case, we have to implement other algorithms.
FOLLOW, UPVOTE or RESTEEM maybe if you like.+VE comments are welcome ❤️
Is that really machine learning? Just seemed like installing some python libraries and plotting a graph.... Interesting and useful none the less.
Downvoting a post can decrease pending rewards and make it less visible. Common reasons:
Submit
I'm glad you liked it. Yes, it is in fact very basic machine learning algorithm( Linear Regression). It's not necessary to use any library at all, for learning purpose you we can just implement the whole mathematical algorithm(as shown above) all by ourself in python, but why reinvent the wheel, after all we will get the same result at the end.😉
Downvoting a post can decrease pending rewards and make it less visible. Common reasons:
Submit
Hi @pankajborah
Just accidently bumped into your profile just to realize that we seem to share a number of interests :)
In particular that we both share a similar passion towards cryptocurrencies and blockchain technology :)
Are you still around? your last post is like 1 month old.
I will follow you closely :) big fat upvote on the way! :)
Yours, Piotr
Downvoting a post can decrease pending rewards and make it less visible. Common reasons:
Submit