Detecting intensity peaks in solar images can be useful as
a simple flare identification mechanism. This example illustrates detection
of those areas where there is a spike in solar intensity.
In this feature I worked on implementing the skimage.feature.peak_local_max
function to find the local peaks in the solar data collected from AIA plot.
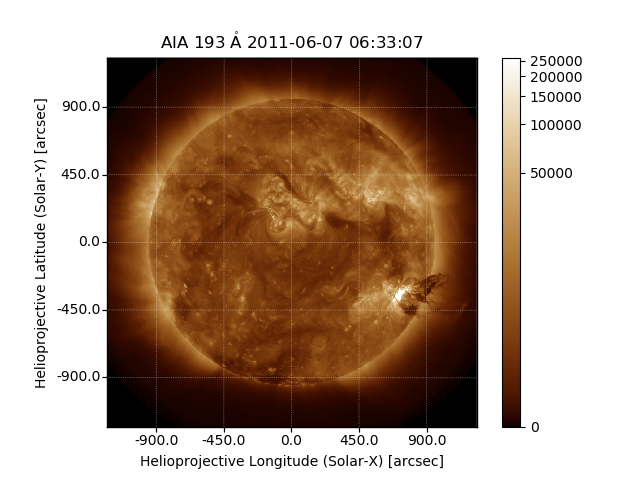
Using the map functionality in SunPy we first plot the AIA data.

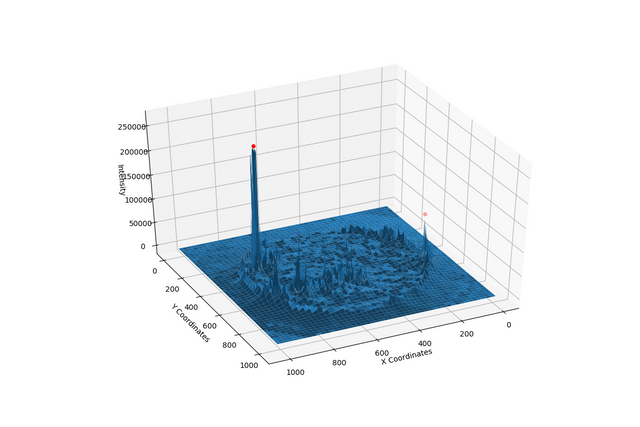
Now using the peak function from skimage we plot the AIA data distribution showing the local peaks.

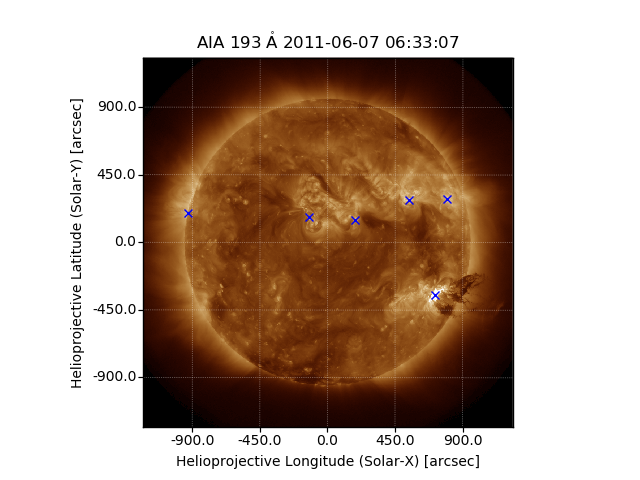
Once we get the local peaks position, we plot those coordinates in the actual AIA map plot.

Pull Request Link.
Posted on Utopian.io - Rewarding Open Source Contributors
Your contribution cannot be approved yet. Please follow the Utopian Rules. This does not fit into Sub-Projects, at best it would be a tutorial if you add way more detail and information.
You may edit your post here, as shown below:

You can contact us on Discord.
[utopian-moderator]
Downvoting a post can decrease pending rewards and make it less visible. Common reasons:
Submit
Congratulations @prateekiiest! You have received a personal award!
Click on the badge to view your Board of Honor.
Do not miss the last post from @steemitboard:
Downvoting a post can decrease pending rewards and make it less visible. Common reasons:
Submit
Congratulations @prateekiiest! You received a personal award!
You can view your badges on your Steem Board and compare to others on the Steem Ranking
Vote for @Steemitboard as a witness to get one more award and increased upvotes!
Downvoting a post can decrease pending rewards and make it less visible. Common reasons:
Submit