
Link to the github repository
https://github.com/steemit/steem
1. INTRODUCTION
On this occasion I want to focus my analysis on the use of the Reblog feature normally known as Resteem.
- Resteem is the share of content you find interesting to your followers. It's like retweet button in tweeter and share button on facebook.
- If you resteem something, it will show up in your blog feed. Those who are following you will see that post.
- If you have curated that post, then it may be to your advantage to resteem it as well, as it will expose more people to the post to vote after you.
- Why we not Resteem every post that comes our way. Sharing is Good, But Caring is Better. You should not ReSteem EVERYTHING that you find. Your followers are following YOU, not someone else. They may find other posts on the same topic very interesting, and that's what you're aiming for here.
I will analyze the temporal evolution for the whole historical period and then I will focus on the period of May/June 2018, and for this period I will do a classification of accounts based on their activity.
Some previous analyzes of other users about this feature
- Utopian-io Resteem Behavior Analysis . 8 months ago.
- Steemit Resteem Acitivity Statistics. 8 months ago.
- Does resteemed post attributes to greater rewards?. 5 months ago.
2. ANALYSIS
I used SteemSQL to get information about posts that have been resteemed.
The Reblogs view contains the following columns:
- account: the user who resteemed a post. (I will call resteemer account)
- author: the author of the resteemed post. (I will call resteemed account)
- permlink: the permlink of resteemed post.
- timestamp: when the post has been resteemed.

2.1. An overview throughout the historical period
Talking about total values
By counting the unique values of each field we obtain the following results:
- Total number of resteems: 5.4 M
- Total number of permlinks: 2.1 M
- Total number of resteemERS accounts: 152,412
- Total number of resteemED accounts: 152,871
It is striking that the number of both types of accounts (resteemERS and resteemED) are almost identical. I expected to find many more resteemers accounts than resteemed accounts as I imagined that a small number of well-known authors (their quality posts) would be recommended by a large amount of accounts.
Since these values refer to the global view of the entire historical period, it could be an average effect and the proportions of these groups seen monthly or daily may be different. As I will show below, these proportions do indeed fluctuate, although they tend to maintain a proportion very close to unity.
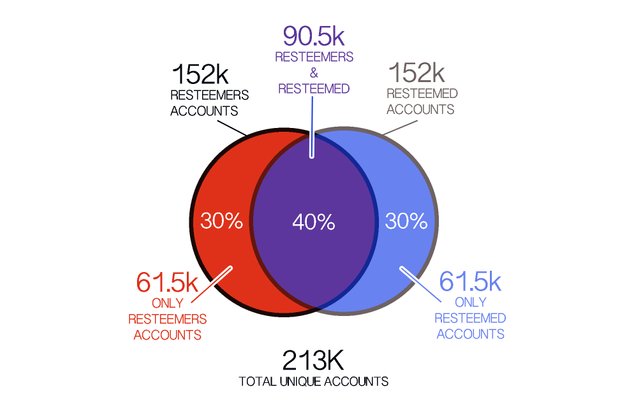
Inspecting the accounts of both groups it can be seen that there are 90.5k (42.3%) accounts that are in the two groups and the number of "ONLY resteemers" accounts = Number of "ONLY resteemed" accounts = 61.5 K (28.8 %) Therefore the total number of unique accounts involved in the resteem process have been: 213.5 K.
Now let´s examine the monthly evolution of these variables.
Using the GroupBy node of Knime.

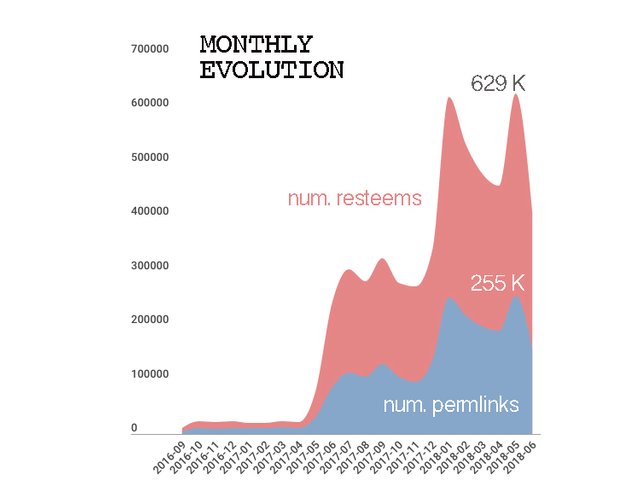
Refering to the monthly evolution throughout the historical period of the number of resteems and the number of permlinks you can see that their volumes grew dramatically for the first time in May 2017 and for the second time in January 2018 to reach approximate values of 629k resteems and 255k permlinks monthly. These peaks were again reached in May 2018 after a decrease of 25% (aprox.) in the previous month of April 2018.
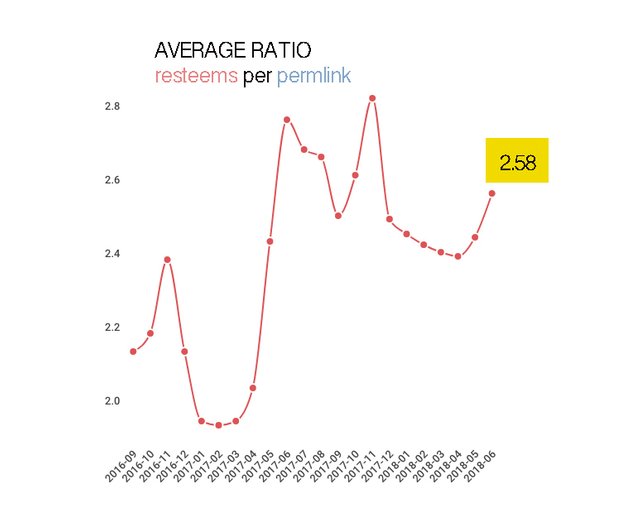
If we calculate the average of resteems per permlink it has been moving between 1.5 and 3. In the last months it was tending to 2.4 and in June of 2018 it stood at 2.58 resteems/permlink.
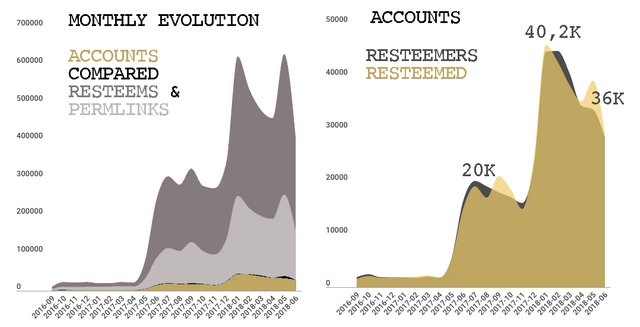
The monthly values of the number of accounts of the two types have varied (since May 2017) between 20K and something more than 40K, standing at around 36K in the last months; currently the number of resteemed accounts exceeds the number of resteemers accounts although always in that dynamic balance in which they have to have very similar magnitudes.
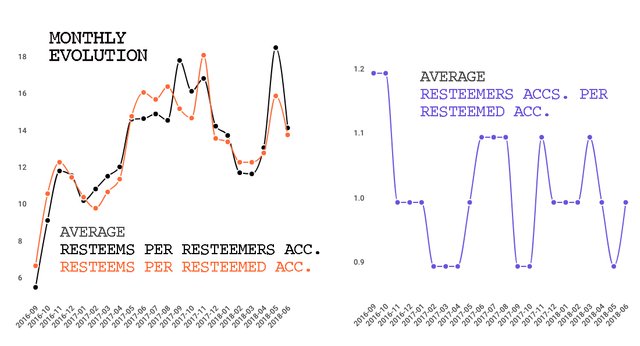
The average number of resteems per resteemer account has fluctuated approximately between 6 and 18, currently standing at 14. The ranges for the resteemed accounts are quite similars with some small differences since their quantities are almost equal as indicated by the figure on the right that fluctuates between 0.9 and 1.2.
An idea of the use of the resteem feature per account
The percentage of resteemers accounts that have made only 1 resteem in the entire historical period turns out to be 26.15%. If we extend it for other low values it is appreciated that 50.62% of the accounts have made only between 1 and 4 resteems.
Resteemers accounts (All historical period)
| no. resteems | no accounts | % |
|---|---|---|
| 1 | 39,850 | 26.15% |
| 2 | 17,808 | 11.68% |
| 3 | 11,503 | 7.55% |
| 4 | 7,988 | 5.24% |
| >4 | 77,149 | 50.62% |
These numbers show that this feature is mainly used in a non-intensive way by the majority of users who use it. This is a good sign, since it seems quite reasonable, in general, someone decides to resteem a post only in certain circumstances and less frequently than to upvote or make a comment. This, in turn, indicates that there is a small percentage of accounts who use it very intensively.
2.2. A more detailed view for May-June 2018
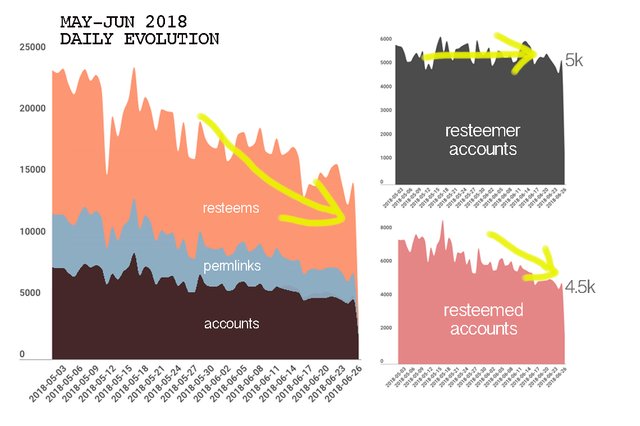
Left fig.
In the months of May and June of 2018 the number of resteems (and the number of permlinks involved) has been decreasing until reaching 14,386 daily resteems (7,004 permlinks)
Right fig.
If we look at the number of accounts, distinguishing between the two types, we see that the number of daily resteemed accounts has also been declining to 4,857 while the number of daily resteemers accounts has remained fluctuating at the level of 5,231 accounts.
Some averages
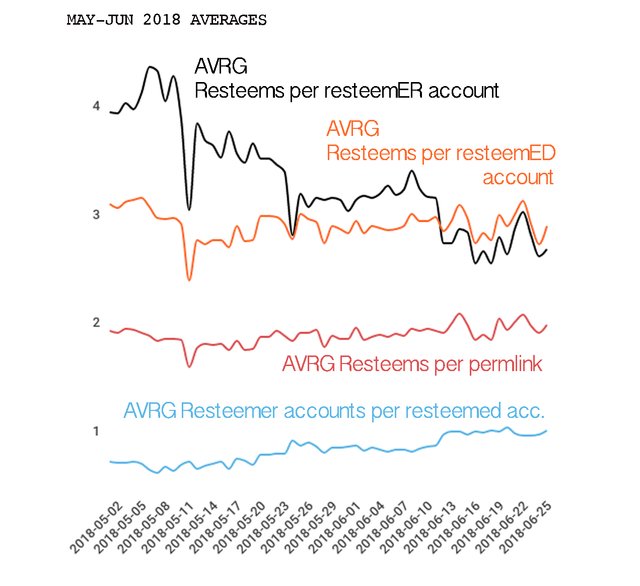
Observing the daily evolutions in the last two months of these averages we could say there is a slight decrease in the activity of the resteemer accounts going from a daily average greater than 4 to less than 3 daily resteems per account.
The rest of the averages fluctuate around fairly stable values.
2.3 Classification of the participating accounts in the resteem process
Previously we have seen the evolution of the volumes of resteemers and resteemed accounts over time. Now we are going to investigate the characterization of each of these types of accounts for the period May-June 2018.
For each account I have calculated
For the ResteemERS accounts
- The number of resteemED accounts.
- Average of no. resteems per resteemED account
For the ResteemED accounts
- The number of resteemERS accounts.
- Average of no. resteems per resteemER account
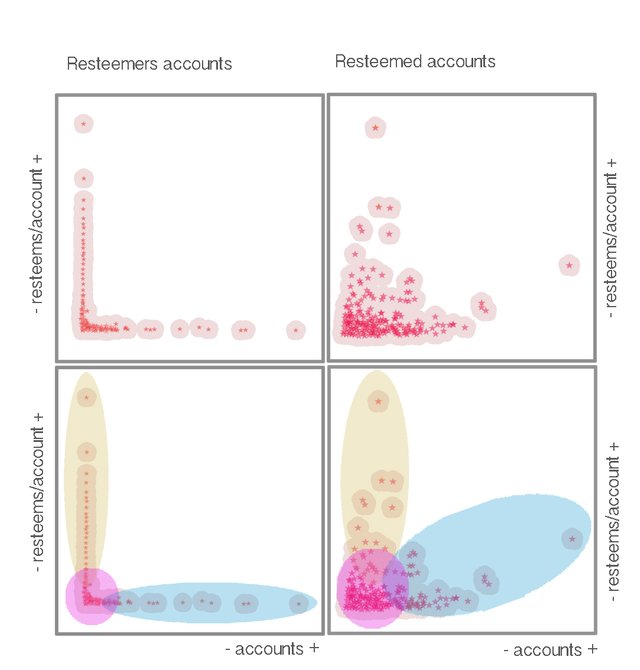
This allows to see the diversity of the accounts in terms of their activity by plotting each account as a point in a plane of axes X(number of accounts), Y(average of resteems per account)
RESTEEMERS ACCOUNTS
- X axis (1-9688)
- Y axis (1-312)
RESTEEMED ACCOUNTS
- X axis (1-2060)
- Y axis (1-301)
LEFT
The Resteemers accounts have a lower dispersion located in two very defined lines, a horizontal one in which the number of resteemed accounts increases and a vertical one in which the average of resteems by resteemed account increases.
The blue subgroup would be accounts that offer resteem services to many accounts.
The yellow subgroup are accounts that perform many resteems to a reduced number of accounts, which could be seen as self-promotional circles.
The magenta subgroup includes most of the accounts with an intermediate behavior that we could denote as natural, organic or reasonable.
RIGHT
The Resteemed accounts shows a greater dispersion in the whole plane and in the subgroups in which we can divide them.
The blue subgroup includes accounts that are resteemed by many accounts that correspond, in general, to prestigious users with good quality posts. They also can include accounts that use large circles of accounts to resteems themselves although their contents are not of good quality and even can be be spam or plagiarism.
The yellow subgroup includes the most suspicious accounts of using small and medium circles of resteemers accounts with a very high activity to promote their posts among theirs followers.
The magenta subgroup again includes the largest number of accounts with a more organic or natural behavior.
Some numerical values of this classification
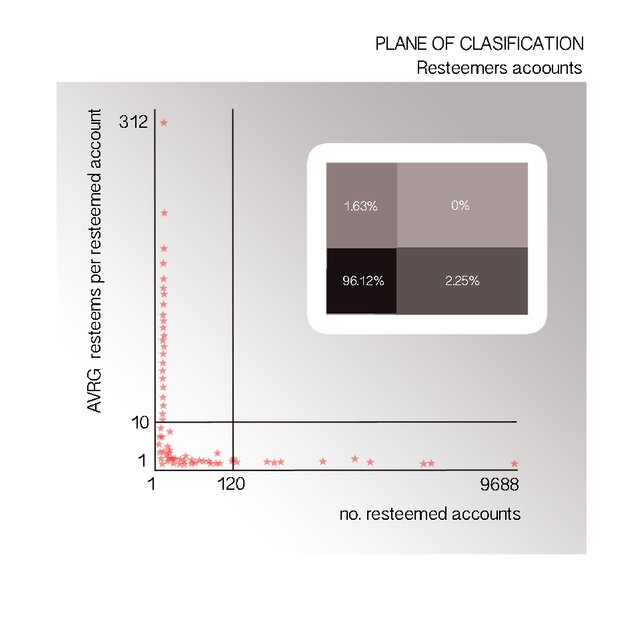
I have made the numerical partition of the subgroups by setting some values that mark the borders between the subgroups. For the resteemers accounts I have chosen the values of 120 for the number of resteemed accounts and 10 for the average of resteems by resteemed account.
X greater than 120 assumes that account has resteemed more than 2 accounts a day (approximately 60 days from May + June). Y greater than 10 assumes that the account has resteemed (in average values) more than 10 times the same resteemed account
This produces that the subgroups are as follows.
- Blue group (X>120)
- Yellow group (Y>10)
- Magenta group (X<=120 AND Y<=10)
| size | % size | id activity | % activity | |
|---|---|---|---|---|
| BLUE G | 996 | 2.25% | 480,033 | 46.28% |
| YELLOW G | 723 | 1.63% | 56,717 | 5.47% |
| MAGENTA G | 42,585 | 96.12% | 500,575 | 48.26% |
| TOTAL | 44,304 | 100% | 1,037,325 | 100% |
I have also calculated for each subgroup the activity (number of resteems performed) of each group.
The Blue subgroup that only includes 2.25% of the accounts has made almost half of the resteems (46.28%) which is a frantic activity typical of the accounts that offer resteem services.
The Yellow subgroup that includes only 1.63% of the accounts is responsible for only 5.47% of the activity, so the impact of these accounts can be considered small.
The magenta subgroup that includes 96% of the accounts is responsible for 48.26% of the resteem activity and is supposed to encompass the accounts with a more natural, organic or logical behavior.
As this magenta subgroup includes so many accounts (42,585), I wanted to investigate the activity of these accounts calculating, for the period of May-June 2018, the number of accounts that have made only 1 resteem, 2 resteems, etc., up to 10 resteems (and more of 10 resteems)
Distribution of accounts by the number of resteems (magenta group)
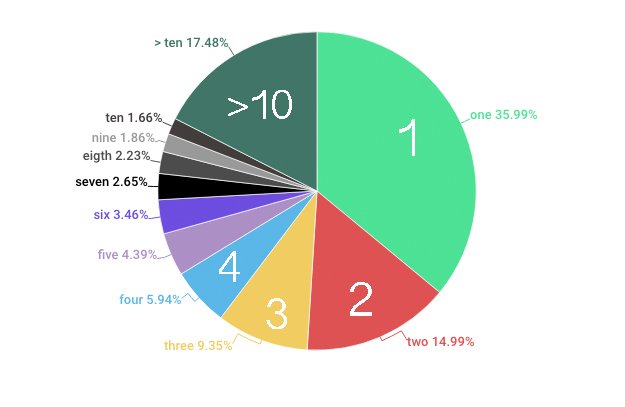
As seen in the pie chart almost 36% of the accounts in this group only made one resteem (and 15% only 2, etc).
This shows that the vast majority of the accounts have a low or very low activity level in terms of the number of resteems performed and could be considered as a good use of the resteem feature.
Returning to the fact that caught my attention at the beginning of the analysis that the number of resteemers accounts and resteemed accounts (global, monthly and daily) are very similar can be explained by the fact that a very high amount (percentage) of accounts performs only one resteem and also the number of resteemed accounts that only receive one resteem is also very high. As the resteem process always involves two accounts, there is a very high probability that each resteem adds a "new resteemer account" and a "new resteemed account" which contributes to increasing both amounts in a similar way.
3. SOURCE, DATES, SQL QUERIES and TOOL
DATA SOURCE
I have used SteemSQL, a publicly available Microsoft SQL database containing all the Steem blockchain data held and managed by @arcange.
DATES
- Scope 1: 2016-07-04 to 2018-06-26
- Scope 2: 2018-05-01 to 2018-06-26
- Submitting date 2018-07-25
SQL QUERIES
The original SQL Query that I made with the DATABASE READER
node of Knime is as simple as:
SELECT * FROM Reblogs
Subsequently I have used several nodes to manipulate the data
- STRING MANIPULATION
- VALUE COUNTER
- GROUP BY
- ROW FILTER
- COLUMN FILTER
- LINE PLOT
- SCATTER PLOT
- SORTER
- CSV WRITER
ANALYSIS TOOL
I have used KNIME, a free and open-source data analytics, reporting and integration platform, to get, filter and manipulated data
KNIME WORKFLOW

@sintoniz, this is an amazing piece of work and will be staff-picked! You've really covered it all, and with great visualizations! I personally would have expected the relative share of resteems from resteem services to be even higher, but almost half of them is already quite a number. Did you look into the distribution on how often the same post is resteemed? With an average around 2, I'd expect a large fraction with a single resteem and a small number of accounts/posts that received a lot of resteems.
Your contribution has been evaluated according to Utopian policies and guidelines, as well as a predefined set of questions pertaining to the category.
To view those questions and the relevant answers related to your post, click here.
Need help? Write a ticket on https://support.utopian.io/.
Chat with us on Discord.
[utopian-moderator]
Downvoting a post can decrease pending rewards and make it less visible. Common reasons:
Submit
nice work - does this package KNIME produce the visualizations?
Downvoting a post can decrease pending rewards and make it less visible. Common reasons:
Submit
Thanks,
KNIME has many nodes to visualize data.
https://www.knime.com/knime-introductory-course/chapter1/section4/data-visualization
I also have used other tools such as https://infogram.com/
and Photoshop to make custom graphics.
Downvoting a post can decrease pending rewards and make it less visible. Common reasons:
Submit
Hey @sintoniz
Thanks for contributing on Utopian.
Congratulations! Your contribution was Staff Picked to receive a maximum vote for the analysis category on Utopian for being of significant value to the project and the open source community.
We’re already looking forward to your next contribution!
Want to chat? Join us on Discord https://discord.gg/h52nFrV.
Vote for Utopian Witness!
Downvoting a post can decrease pending rewards and make it less visible. Common reasons:
Submit