Image source
What Will I Learn?
Greetings, in this tutorial we will continue the usage of Monte Carlo method to simulate a fair dice rolling experiment with the aid of Octave. As you know last time we used it to make a coin toss simulation and observed that the increase of the amount of trial will eventually cause the probability to reach the desired, ideal or theoritical values.
- You will learn Monte Carlo method
- Probobility distribution of dice rolling
- Function writing in Octave
- Bar plotting with Octave
Requirements
- Octave 4.2
- Basic knowledge on coding
- Basic knowledge on probablity distribution
- Information about Monte Carlo method
Difficulty
Either choose between the following options:
- Intermediate
Tutorial Contents
As it was depicted in the previous coin flip simulation we better need to remember what was Monte carlo method and why we're using it. Monte Carlo method is used in cases where repeating the same experiment will get the user closer to the optimal values. So in this case we are expecting a 1/6 propability of getting 1,2,3,4,5 or 6 in each roll. Since the dice is assumed to be fair and there is no trick we can calculate it simply the ratio between The amount of desired outcomes to the The number of possible outcomes,

So by using the above formular we can easly claim that the probability of getting any number on a fair dice is 1/6 or approximately 0.1667.
To test this we will roll our dice 10, 100, 1000 and 10.000 times to see how close we are to these theoritical values.
Firstly as usual we shall begin by defining our function,
function [retval] = diceroll (x)
This above code will generate a return value function having one variable x and a named function diceroll. Then secondly our new task is to define x,
The variable x will be the amount of trials or the number of times which the user wants to cointoss. We will define x as trials and trials as an input number,
 trials = 'How many times you want to roll the dice? ';
x = input(trials);
Now we know that how many times the user wants to roll the dice. We should define a matrix having random values from 1-6 representing the outcome of the dice. To do that we should use randi function instead of rand since we want it to start from one not zero. Then the size of this function will be arranged by user entered trial values,
matrix = randi([1,6],1,x); Thirdly we should know the amount of 1,2,3,4,5 and 6's in the experiment. To full fill that task we may simply use sum(matrix(:)) formula,
numberone = sum(matrix(:) == 1);
numbertwo = sum(matrix(:) == 2);
numberthree = sum(matrix(:) == 3);
numberfour = sum(matrix(:) == 4);
numberfive = sum(matrix(:) == 5);
numbersix = sum(matrix(:) == 6);
The above code will return the amount of one's, two's, .. six's in the experiment. Now we need to show them on bar graph,
x0 = 1:1:6;
y1 = [numberone, numbertwo, numberthree, numberfour, numberfive, numbersix];
bar(x0,y1)
To label the axes and graph title,
title(['Probability of getting 1,2,3,4,5 or 6 on ',num2str(x),' trials.'],'FontSize',22,'Color','r')
xlabel('Results; (1-6) For dice values.','FontSize',22)
ylabel('Total number of head and tails','FontSize',22)
Finally to calculate the percentages of these outcomes and show them on the graph,
title(['Probability of getting 1,2,3,4,5 or 6 on ',num2str(x),' trials.'],'FontSize',22,'Color','r')
xlabel('Results; (1-6) For dice values.','FontSize',22)
ylabel('Total number of head and tails','FontSize',22)
numberoneper = (numberone * 100 ) / (x)
numbertwoper = (numbertwo * 100)  / x
numberthreeper = (numberthree * 100) /x
numberfourper = (numberfour * 100) / x
numberfiveper = (numberfive * 100) / x
numbersixper = (numbersix * 100) / x
x1=0.8;
x2=1.8;
x3=2.8;
x4=3.8;
x5=4.8;
x6=5.8;
txt1 = ['%',num2str(numberoneper)];
t = text(x1,1,txt1,'Color','white','FontSize',14);
txt2 = ['%',num2str(numbertwoper)];
t2 = text(x2,1,txt2,'Color','white','FontSize',14);
txt3 = ['%',num2str(numberthreeper)];
t3 = text(x3,1,txt3,'Color','white','FontSize',14);
txt4 = ['%',num2str(numberfourper)];
t4 = text(x4,1,txt4,'Color','white','FontSize',14);
txt5 = ['%',num2str(numberfiveper)];
t5 = text(x5,1,txt5,'Color','white','FontSize',14);
txt6 = ['%',num2str(numbersixper)];
t6 = text(x6,1,txt6,'Color','white','FontSize',14);
Keep in mind that the x1,x2,x3,...x6 values must be changed in each trial to fit the graph perfectly.
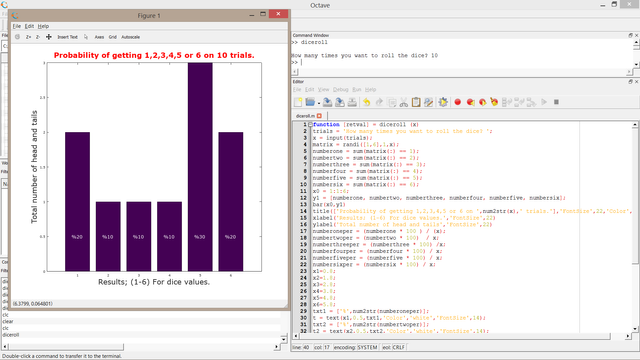
For 10 trials
 function [retval] = diceroll (x)
trials = 'How many times you want to roll the dice? ';
x = input(trials);
matrix = randi([1,6],1,x);
numberone = sum(matrix(:) == 1);
numbertwo = sum(matrix(:) == 2);
numberthree = sum(matrix(:) == 3);
numberfour = sum(matrix(:) == 4);
numberfive = sum(matrix(:) == 5);
numbersix = sum(matrix(:) == 6);
x0 = 1:1:6;
y1 = [numberone, numbertwo, numberthree, numberfour, numberfive, numbersix];
bar(x0,y1)
title(['Probability of getting 1,2,3,4,5 or 6 on ',num2str(x),' trials.'],'FontSize',22,'Color','r')
>xlabel('Results; (1-6) For dice values.','FontSize',22)
ylabel('Total number of head and tails','FontSize',22)
numberoneper = (numberone * 100 ) / (x);
numbertwoper = (numbertwo * 100)  / x;
numberthreeper = (numberthree * 100) /x;
numberfourper = (numberfour * 100) / x;
numberfiveper = (numberfive * 100) / x;
numbersixper = (numbersix * 100) / x;
x1=0.8;
x2=1.8;
x3=2.8;
x4=3.8;
x5=4.8;
x6=5.8;
txt1 = ['%',num2str(numberoneper)];
t = text(x1,0.5,txt1,'Color','white','FontSize',14);
txt2 = ['%',num2str(numbertwoper)];
t2 = text(x2,0.5,txt2,'Color','white','FontSize',14);
txt3 = ['%',num2str(numberthreeper)];
t3 = text(x3,0.5,txt3,'Color','white','FontSize',14);
txt4 = ['%',num2str(numberfourper)];
t4 = text(x4,0.5,txt4,'Color','white','FontSize',14);
>txt5 = ['%',num2str(numberfiveper)];
t5 = text(x5,0.5,txt5,'Color','white','FontSize',14);
txt6 = ['%',num2str(numbersixper)];
t6 = text(x6,0.5,txt6,'Color','white','FontSize',14);
endfunction 
20% of getting 1 or 6, 10% of getting 2,3 or 4 and 30% of getting 5. Quite high difference between the probabilities.(20% difference among getting 5 and 2,3 or 4)
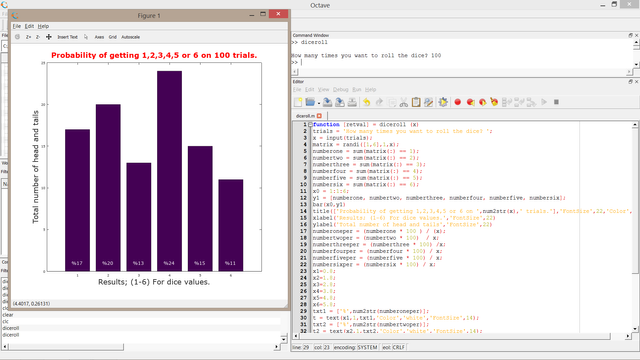
For 100 trials
function [retval] = diceroll (x)
trials = 'How many times you want to roll the dice? ';
x = input(trials);
matrix = randi([1,6],1,x);
numberone = sum(matrix(:) == 1);
numbertwo = sum(matrix(:) == 2);
numberthree = sum(matrix(:) == 3);
numberfour = sum(matrix(:) == 4);
>numberfive = sum(matrix(:) == 5);
numbersix = sum(matrix(:) == 6);
x0 = 1:1:6;
>y1 = [numberone, numbertwo, numberthree, numberfour, numberfive, numbersix];
>bar(x0,y1)
>title(['Probability of getting 1,2,3,4,5 or 6 on ',num2str(x),' trials.'],'FontSize',22,'Color','r')
xlabel('Results; (1-6) For dice values.','FontSize',22)
ylabel('Total number of head and tails','FontSize',22)
numberoneper = (numberone * 100 ) / (x);
numbertwoper = (numbertwo * 100)  / x;
numberthreeper = (numberthree * 100) /x;
numberfourper = (numberfour * 100) / x;
numberfiveper = (numberfive * 100) / x;
numbersixper = (numbersix * 100) / x;
x1=0.8;
x2=1.8;
x3=2.8;
x4=3.8;
x5=4.8;
x6=5.8;
txt1 = ['%',num2str(numberoneper)];
t = text(x1,1,txt1,'Color','white','FontSize',14);
txt2 = ['%',num2str(numbertwoper)];
t2 = text(x2,1,txt2,'Color','white','FontSize',14);
txt3 = ['%',num2str(numberthreeper)];
t3 = text(x3,1,txt3,'Color','white','FontSize',14);
txt4 = ['%',num2str(numberfourper)];
t4 = text(x4,1,txt4,'Color','white','FontSize',14);
>txt5 = ['%',num2str(numberfiveper)];
t5 = text(x5,1,txt5,'Color','white','FontSize',14);
txt6 = ['%',num2str(numbersixper)];
t6 = text(x6,1,txt6,'Color','white','FontSize',14);
endfunction 
Where know we have 24% of getting 4, 20% to 2, 17% to 1, 15% to 5 ,13% to 3 and 11% to 6. Where the gap between highest possibility (4) and lowest (6) is 13%. Kinda low compared to 10 trials.
In our next tutorial we will continue simulating it for 1000 and 10.000 trials.
Curriculum
- Advanced drawing with Octave
- Two and three dimensional plotting with 'Octave'
- Solve and plot your equations with Octave!
- Coin toss simulation with Monte Carlo method
Posted on Utopian.io - Rewarding Open Source Contributors
Your contribution cannot be approved because it does not follow the Utopian Rules.
You can contact us on Discord.
[utopian-moderator]
Downvoting a post can decrease pending rewards and make it less visible. Common reasons:
Submit
Hello thank you for your feedback. I did add the code blocks however i didnt understand exactly what is 'bad' about formatting. As you can see i used the same format in my previous tutorial (https://utopian.io/u/25430207) and it was approved.
Downvoting a post can decrease pending rewards and make it less visible. Common reasons:
Submit