Greetings, in our this tutorial we will start discovering Octave, leading advanced mathematical & numerical calculation language and software. To begin with following question must be revealed for newcomers to understand it clearly,
To whom this software is designed and useful?
Since it's a mathematical calculation software any branches or work where there are numbers could be a part of this software. Including but not limited to, signal processing, algebra calculations, solving complex differential equations, probability and random process observation, noise cancellation sound waves, simulations and even image processing.
Briefly, any individual who wants to have an intuition of how math is connected to our daily life can use it as a hobby.

In this zeroth, introduction tutorial we will focus on initialization, solving and plotting of first & second order simple equation with the aid of Octave.
How to download?
To download the software simply go to its official site, Octave download and then download the installation file by selecting your operating system and it will download the 184 MB execution file. In few minutes it will install the 1.58Gb software or you may completely download the zipped file.
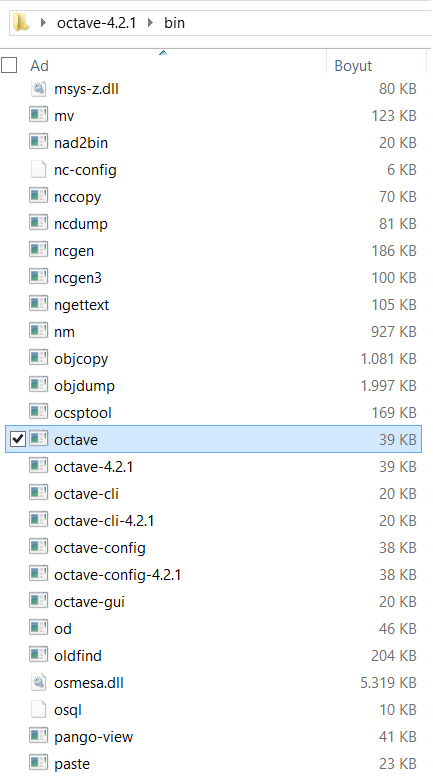
To run the software find the bin folder inside the main repository and run the 'Octave' file as shown in the picture below,
Getting used to the user interface
Once the software properly runned, you will see four main panels named; File browser, workspace, command history and command window.
File browser: Where you can search for your previous saved works.
Workspace: A panel shows the input values and their properties. For example the value of A variable will be 2 according to the following input.
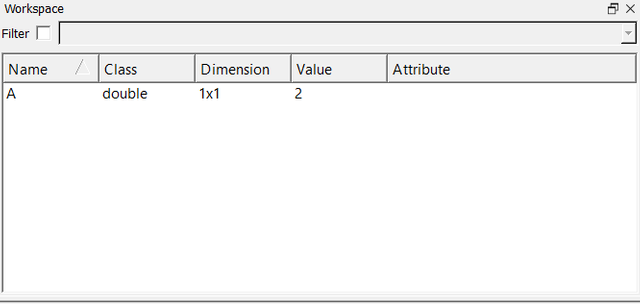
Where in the above picture, A represents the name of the variable that was defined by us, Class determines the variable A's range. For this example double means A can get any rational number or integers plus decimals. Dimension shows the row and column of A since we only have the number 2 the A matrix will be a unit 1x1 one. And finally value is the the number(s) inside the matrix.
Let's solve some equations!
In this lecture, to be simple and make an introduction we will only focus at first order linear equations means that the order (highest degree) of the unknowns will be one and the equation can be written as,
Ax + By = C
Some examples of these equations,
3x + 5y = 9
(7/2)x + 8y = 3
(7/2)x = 3
5y = 29
sqrt(2x) + y = 9
2x + 7y = 0
Suppose we want to find the solution set of the first two equations. Of course it will be simple since we have first order linear equations but it's vital to start from scratch so that we can proceed in my following tutorials. So we have below two equations,
3x + 5y = 9
(7/2)x + 8y = 3
And we want to solve them in Octave. To do that we will use row echelon form. Although it won't be much effective in relatively simple equations like these ones it's vital to use when the amount of unknowns and equations are more than two.
Back to topic to apply row echelon form we transformed above two equations into matrices and define them on octave by typing the following code,
D = [3 5 9 ; 7/2 8 3]
This will pop up the values of matrix D where the first row shows the coefficients A,B and C in Ax + By = C
Then simply the second row so that the first element becomes 0 and only the coefficient of Y remains. The calculation was made by Octave and shown below,
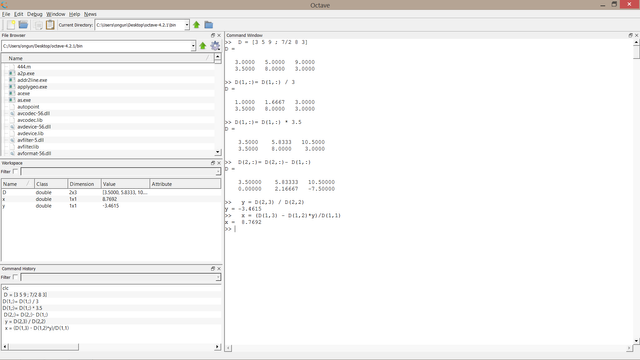
where D(1,:) means the first row of D matrix, D(1,1) first element, and x,y the coordinates of the crossing of these two lines.
As a result we found x to be 8.7692 and y to be -3.4615. To check the results we may simply plug it in any of the above equation but to learn and practise plotting it's better to plot these two functions and see their crossing.
To do that below coding was performed and graph was obtained,
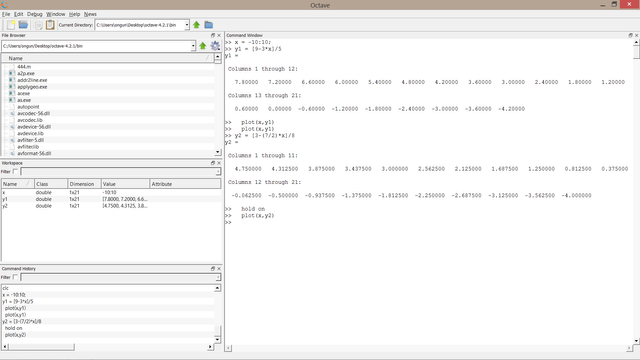
and below graph formed
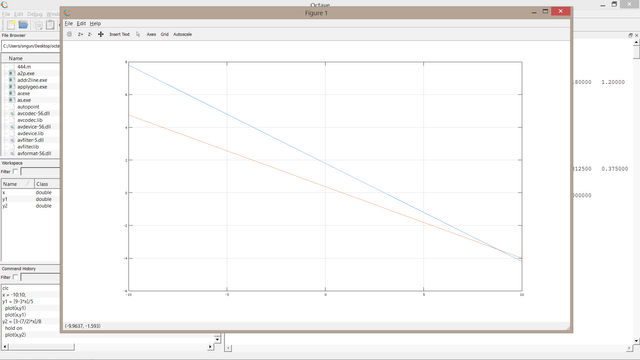
in the code plot(x,y) is a function of graphing its inputs, hold on enables user to plot more than one graphs on same figure.
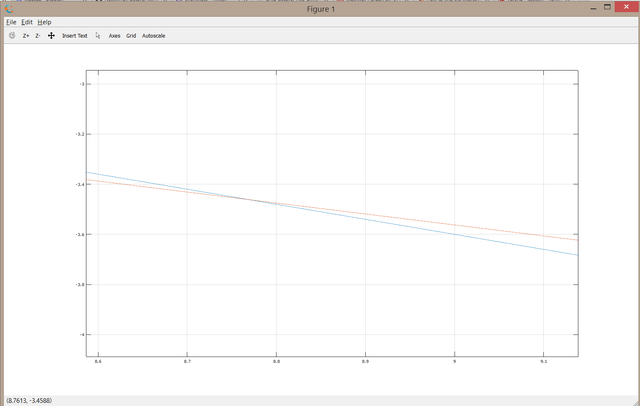
So from the graph if we check the intersection of these two lines we can see a point around x= 8.7613 and y=-3.4588, pretty accurate compared to our previous results!
In our following lectures we will solve the intersection of quadratic and trinomial equations, discover gui, and witness why Octave is quite important in communication systems noise cancellation.
With your support,
Octave Github repository
@wodsuz ©
Posted on Utopian.io - Rewarding Open Source Contributors
Thank you for the contribution. It has been approved.
You can contact us on Discord.
[utopian-moderator]
Downvoting a post can decrease pending rewards and make it less visible. Common reasons:
Submit
Cheers :)
Downvoting a post can decrease pending rewards and make it less visible. Common reasons:
Submit
Hey @wodsuz I am @utopian-io. I have just upvoted you!
Achievements
Suggestions
Get Noticed!
Community-Driven Witness!
I am the first and only Steem Community-Driven Witness. Participate on Discord. Lets GROW TOGETHER!
Up-vote this comment to grow my power and help Open Source contributions like this one. Want to chat? Join me on Discord https://discord.gg/Pc8HG9x
Downvoting a post can decrease pending rewards and make it less visible. Common reasons:
Submit