Vertcoin poised for long-term upside
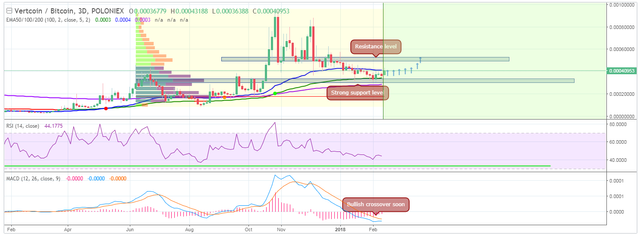
Firstly, I think, that Vertcoin technical chart will flash a bullish MACD crossover in the next two weeks. A bullish MACD crossover occurs when the MACD rises above the signal line. It is an indicator of a bullish trend, indicating that Vertcoin price will be headed higher in the near-term, which is in alignment with the longer term uptrend on the chart.Secondly, Vertcoin’s price has found support from its 100-Day EMA, and the next level of resistance will come from the 50 day EMA. The bullish signal from the MACD will also echo by the RSI, which is reading of 44.4, which is far from the threshold of 30 used to identify oversold securities, but it can scare off to open a long position, so I advise you to wait for the bullish MACD crossover on 3D TF.

https://www.tradingview.com/chart/VTCBTC/WTSDIXBa-Vertcoin-poised-for-long-term-upside/
XVG Bear Market
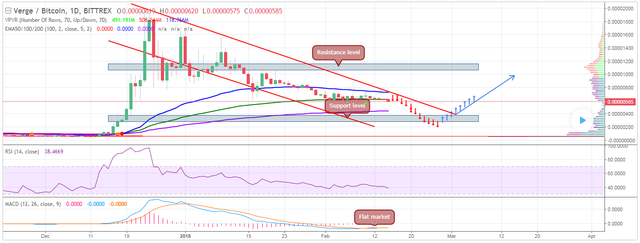
Let’s start with the long term view of the XVG. The Relative Strength Index is a good indicator of the cyclical bull and bear markets. In addition, the Exponential Moving Average acts as support in a bull market and resistance in a bear market.In January, we fell into a bear market as the RSI dropped below 50. The coin fell through the rising trend line and MACD crossed below zero. This is consistent with the fundamentals of a weakening trend, and a recession.In the turmoil of January, VERGE fell below the support 50-Day EMA, which were indicators of further weakness. Now the coin testing the 100-Day EMA.The MACD is trending down, though it is at a low point where it normally turns up.We could also see a pull back from the support level at 300 Sats before making a push up through next resistance level at 600 Sats. If this happens, use the dip in price as a buying opportunity.

https://www.tradingview.com/chart/XVGBTC/pOF9Dx93-XVG-Bear-Market/
WAVES. Possibly a rally up
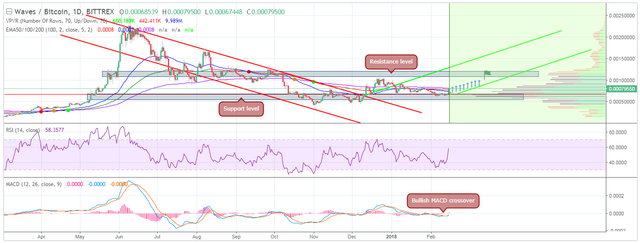
This is where the action was really interesting today. WAVES climbed above gap 50-Day EMA resistance while the MACD and RSI turning up to support price with divergences forming on the MACD. When the WAVES rises through the 100-Day and 50-Day EMA, we will have a buy sign. Long term the trend is still down, but we are likely to see consolidation at this level and possibly a rally up to resistance at the 0.001 area.

https://www.tradingview.com/chart/WAVESBTC/0AEKocJJ-WAVES-Possibly-a-rally-up/
Join telegram channel — https://t.me/HellsCrypto
Join telegram trading chat — https://t.me/HellsCryptoTrading
Join telegram trading News — https://t.me/HellsCryptoNews
I trade Bitcoin Futures,XRP,ETH,ETC,ADA,XLM,NEO,BCH,Dash with x100 leverage here https://goo.gl/z6ue26
Please do your own research in addition to reading the TA. NEVER INVEST MORE THAN YOU CAN AFFORD TO LOSE