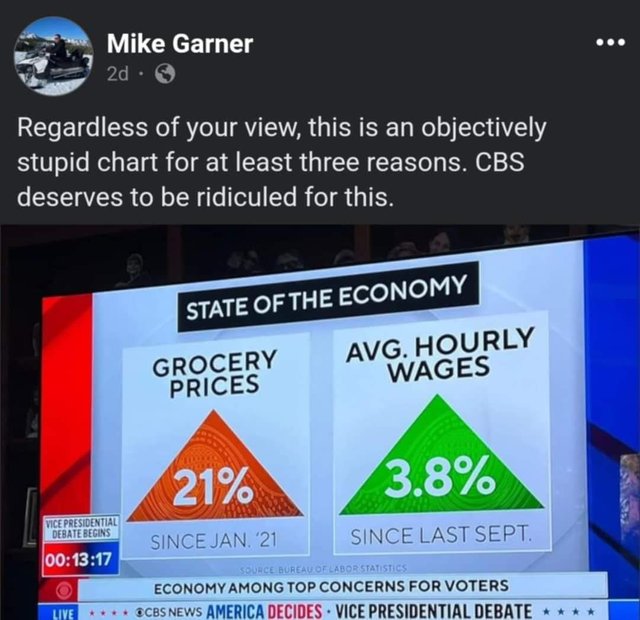
If you're curious, average hourly wages have increased by 18% since January 2021.
And since September 2023, grocery prices have gone up less than 1%.
The real problem with this chart besides the different time frames is groceries are just one part of the overall consumer budget. We have CPI for a reason. CPI is the average consumer basket of goods and services with appropriate weights accordingly (including shelter).
So on that note, CPI has increased by 20% since January 2021. And has increased by 2.2% since September 2023.