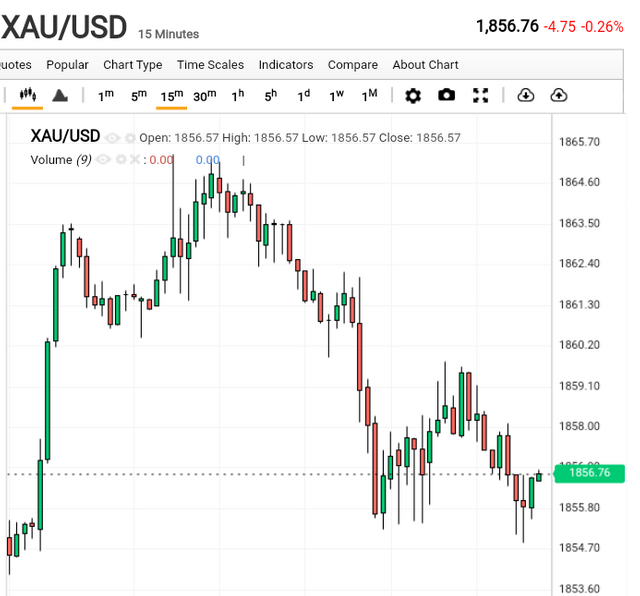
Technical analysis suggests that if gold prices fall below $1,833, they could reach the multi-month low of $1,810.
A convincing break below $1,833 would confirm the end of the corrective bounce and trigger a sharp decline.
The death cross on the daily chart, where the 50-day SMA is well below the 200-day SMA, further supports this bearish outlook.
Bulls are likely to wait for a sustained break above $1,865 before positioning for a move towards the next hurdle at $1,885, followed by the key $1,900 level, which is near the 50-day SMA.
Some follow-through buying above $1,900 would suggest that gold has formed a near-term bottom and could challenge the 200-day SMA at $1,928-1,930.
Disclaimer: Gold price predictions are just that - predictions. The actual price of gold could move outside of the predicted ranges, and investors should always do their own research before making any investment decisions.