Bitcoin complete historical price chart with monthly RSI

in ya •  3 years ago  (edited)

This is a very consistent & accurate way to analyze bitcoin price. You can see Montly RSI curve is nearly smooth curve and keep in mind monthly RSI when bitcoin price is bottom & peak of each cycle.
So use these data to when to enter & exit bitcoin market.
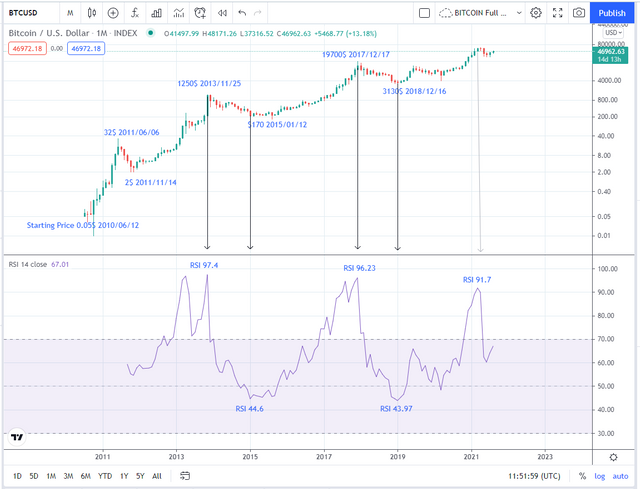
image_2021-08-17_045516.png

Authors get paid when people like you upvote their post.
If you enjoyed what you read here, create your account today and start earning FREE STEEM!
Sort Order:  
Loading...