I covered Zencash (ZEN) nearly a month ago when it was around $40 after buying my first position in a long time. You might think I'm disappointed with this decision, but as I explained I had intended to buy at different levels to reduce exposure.
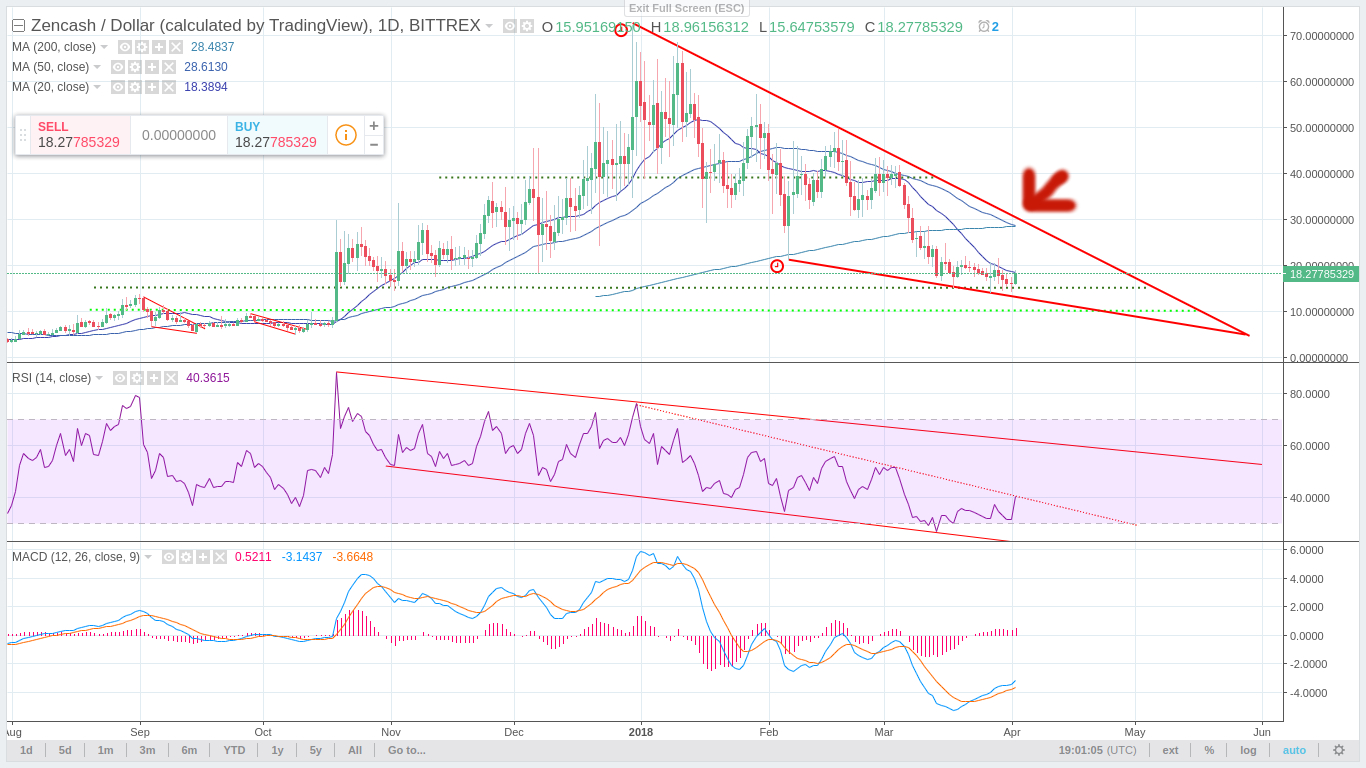
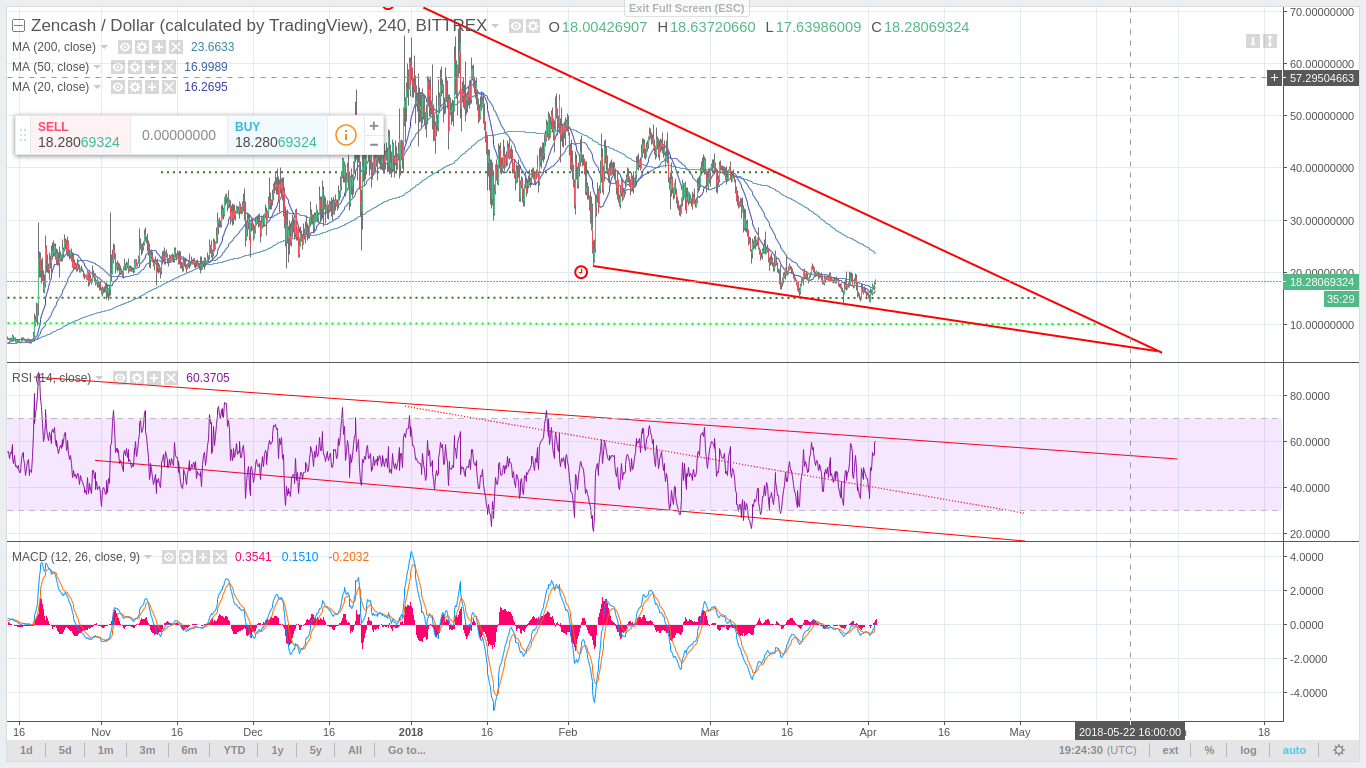
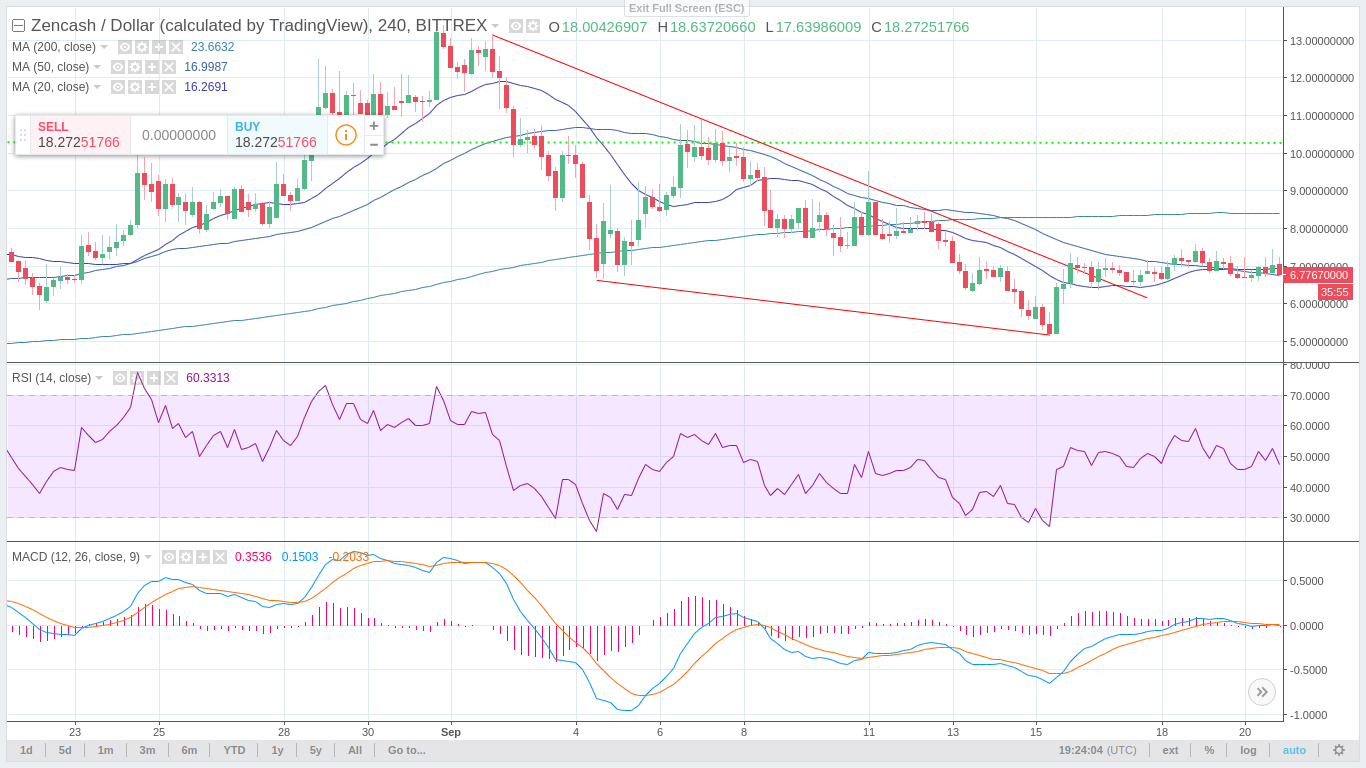
While previously suggesting I would add to this position around $20-25, like many people I have held back as the market continues to correction with it's bearish conditions. Zencash is now trading consistently inside a descending triangle formation. As interesting is that the death cross is now imminent.
The death cross, as you might of learnt recently, is when the 50-day moving average crosses the 200-day moving average, as can be seen marked in the graph above. As was the case with Bitcoin just last week, it appears not to have been a catalyst for increased selling, but instead so far has only caused sideways trading.
Reasons for this is due to the oversold conditions of BTC, that has caused the 50-day to be pulled down so quickly, similarly to ZEN as well as other altcoins. In summary the result of high volatility is more likely to bring about death crosses in the cryptocurrency markets.
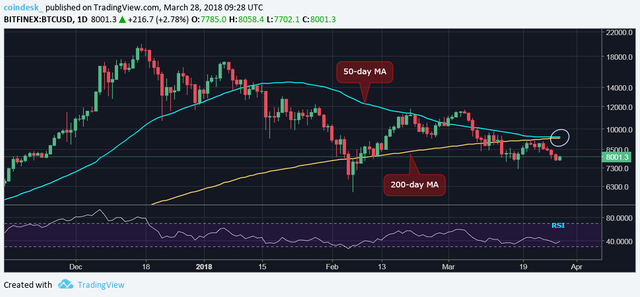
Unlike traditional markets however it isn't considered to be as bearish in the same long-term manner, while in the short-term it represents the likelihood of a continued FUD sell off with a sharp recovery. This theory is supported by numerous crypto analysts with experience in both crypto and traditional markets. Some even consider Bitcoin's death cross to be a bear trap

That said, in the short-term I do expect Zencash to drift further down further, before breaching the resistance downtrend line. The RSI is also in a long-term downtrend from October indicating further selling towards or below 20 is more than possible.
Personally I intend to add positions of 20-30% around the $10-$15 level if the descent continues. This is the tight margin between the lighter and darker green dotted lines, within the descending triangle.
Alternatively, should the break out head south in a hurry I would look to buy below $10 towards $5, or otherwise add positions if ZEN breached the Long-Term Resistance Trend Line.
This is a risky move admittedly, as the breakout could go south and Zencash could plunge to the $5 mark. However, ZEN is showing strength against Bitcoin and I'm expecting a sharp drop to be met with a sharp bounce. Furthermore, I'm not trying to catch the bottom here, I'm trying to get my positions settled before a break out north, or sharp recovery.
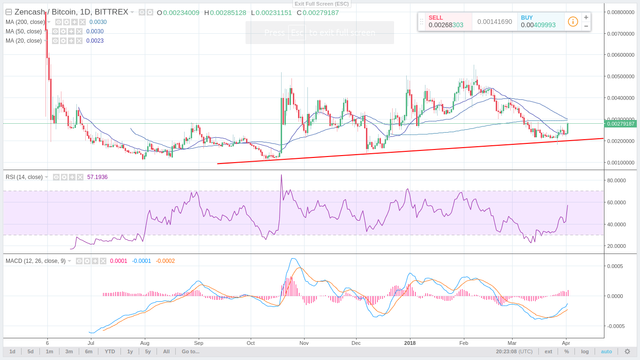
Study the pattern from last year, that can be vaguely made out in the first image but otherwise clearer below. You can see how an extended bear market can lead to a swift recovery from lower market capitalization coins, without the need for much sideways trading or consolidation.
Note how the Resistance Trend Line becomes the Support Trend Line that Zencash bounces off. Ideally the same scenario could happen again, and therefore buying the suggested set ups might be safe bet.
Please note: I am not a financial adviser and this is only for my strategy for my long-term portfolio. This is not recommended as a day trade, but is about laddering into discounts for the long-term.
nice post bro
Downvoting a post can decrease pending rewards and make it less visible. Common reasons:
Submit