I have been tweeting constantly, and telling all of our investors, and anyone else who will listen, that TIPS are being priced at levels that are, to use a technical term, kooky. With current median inflation around 2.9%, 10-year breakevens are being priced at 0.94%. That represents a real yield of about -0.23% for 10-year TIPS, and a nominal yield of about 0.71% for 10-year Treasuries. The difference in these two yields is 0.94%, and is approximately equal to the level of inflation at which you are indifferent to owning an inflation-linked bond and a nominal bond, if you are risk-neutral.
First, a reminder about how TIPS work. (This explanation will be somewhat simplified to abstract from interpolation methods, etc). TIPS, the U.S. Treasury’s version of inflation-linked bonds, are based on what is often called the Canadian model. A TIPS bond has a stated coupon rate, which does not change over the life of the bond and is paid semiannually. However, theprincipalamount on which the coupon is paid changes over time, so that the stated coupon rate is paid on a different principal amount each period. The bond’s final redemption amount is the greater of the original par amount or the inflation-adjusted principal amount.
Specifically, the principal amount changes each period based on the change in the Consumer Price All Urban Non-Seasonally Adjusted Index (CPURNSA), which is released monthly as part of the Bureau of Labor Statistics’ CPI report. The current principal value of a TIPS bond is equal to the original principal times the
Index Ratiofor the settlement date; the
Index Ratiois the CPI index that applies to the coupon date divided by the CPI index that applied to the issue date.
To illustrate how TIPS work, consider the example of a bond in its final pay period. Suppose that when it was originally issued, the reference CPI for the bond’s dated date (that is, its Base CPI) was 158.43548. The reference CPI for its maturity date, it turns out, is 201.35500. The bond pays a stated 3.375% coupon. The two components to the final payment are as follows:
(1) Coupon Payment = Rate * Day
Count * Stated Par * Index Ratio
= 3.375% * ½ * $1000 * (201.35500/158.43548)
= $21.45
(2) Principal Redemption = Stated Par * max 1, Index Ratio
= $1000 * (201.35500/158.43548)
= $1,270.90
Notice that it is fairly easy to see how the construction of TIPS protects the real return of the asset. The Index Ratio of 201.35500/158.43548, or 1.27090, means that since this bond was issued, the total rise in the CPURNSA – that is, the aggregate rise in the price level – has been 27.09%. The coupon received has risen from 3.375% to an effective 4.2892%, a rise of 27.09%, and the bondholder has received a redemption of principal that is 27.09% higher than the original investment. In short, the investment produced a return stream that adjusted upwards (and downwards) with inflation, and then redeemed an amount of money that has the same purchasing power as the original investment. Clearly, this represents a real return very close to the original “real” coupon of 3.375%.
Now, there is an added bonus to the way TIPS are structured, and this is important to know at times when the market is starting to act like it is worried about deflation. No matter what happens to the price level, the bond will never pay back less than the original principal. So, in the example above the principal redemption was $1,270.90 for a bond issued at $1,000. But even if the price level was now101.355, instead of201.355, the bond would still pay $1,000 at maturity (plus coupon), even though prices have fallen since issuance. That’s why there is a “max ” operator in the formula in (2) above.
So, back to our story.
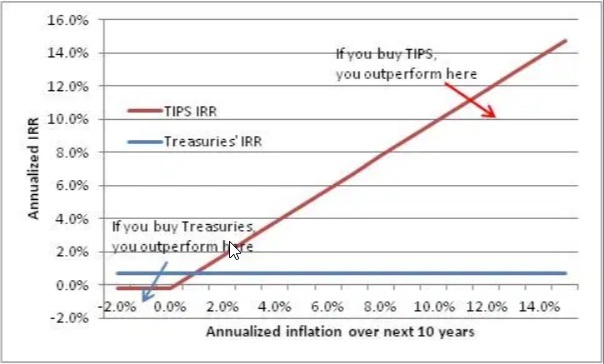
If actual inflation comes inabovethe breakeven rate, then TIPS outperform nominals over the holding period. If actual inflation comes inbelowthe breakeven rate, then TIPSunderperform over the holding period. But, because of the floor, there is a limit to how much TIPS can underperform relative to nominals. However,there is no limit to how much TIPS can outperform nominals. This is illustrated below. For illustration, I’ve made the x-axis run from -4% compounded deflation over 10 years to 13% compounded inflation over 10 years. The IRR line for the nominal Treasury bond is obviously flat…it’s a fixed-rate bond. The IRR line for the TIPS bond looks like a call option struck near 0% inflation.
TIPS: IRR Line For Nominal Treasury Bond  TIPS: IRR Line For Nominal Treasury Bond
Note that, no matter how far I extend the x-axis to the left, no matter how much deflation we get, you will never beat TIPS by more than about 1% annualized. Never. On the other hand, if we get 3% inflation then you’llloseby 2% per year. And it gets worse from there.
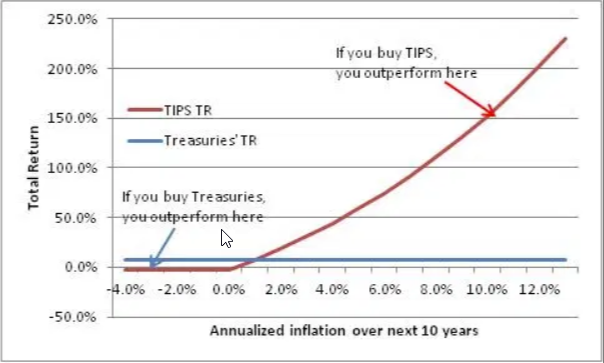
Because annualizing the effect makes this seem less dramatic, let’s look instead at theaggregatetotal return of TIPS and Treasuries. For simplicity, I’ve assumed that coupons are reinvested at the current yield to maturity of the 10-year note, which would obviously not be true at high levels of inflation but is in fact the simplifying assumption that the bond yield-to-maturity calculation makes.
TIPS: Aggregate Total Return  TIPS: Aggregate Total Return
So, if you own TIPS in a deflationary environment, you’ll underperform by about 10% over the next decade. Treasuries will return 7.3% nominal; TIPS will return -2.3% nominal. Unfortunate, but not disastrous. But if inflation is 8%, then your return on Treasuries will still be 7.3%, but TIPS will return 103%. Hmmm. Yay, your 10-year nominal Treasuries paid you back, plus 7.3% on top of that. But that $1073 is now worth…$497. Booo.
So the point here is that at these prices you should probably own TIPSeven if you think we’re going to have deflation, unless you arereallyconfident that you’re right. You are making a much bigger bet than you think you’re making.