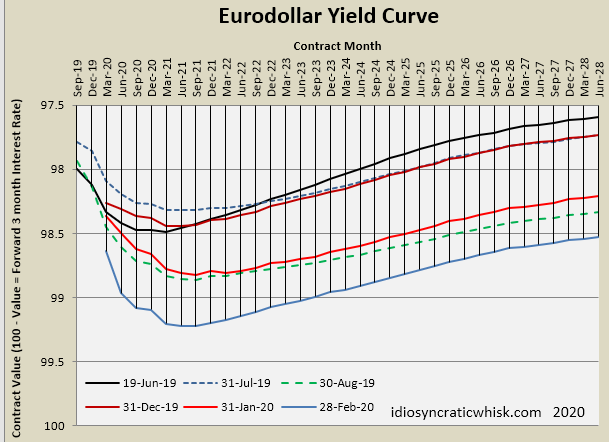
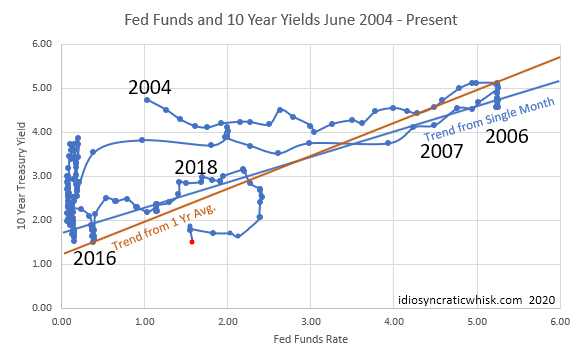
Well, this month appears to have presented the triggering event that will tip the Fed's hawkish bias over the tipping point. It seems likely now that the Fed will chase the natural rate down to zero from here and there will be some sort of traditional contraction or recession related to the cycle. In other words, in the second chart, we should have hoped for the dots to move up, but instead, they will likely move sharply to the left. That chart uses monthly averages, so the 10-year yield is already well below the February point (in red). The Fed is expected to announce an emergency rate cut. Obviously, they should. But, unless sub-1% short rates somehow leads to the 10-year moving up to 2% or 3%, there will likely be some period of economic contraction before rates increase again.
Euro
Dollar Yield Curve  Euro
Euro
Dollar Yield Curve
That means there probably still are some gains to be wrung out of a long bond position. Regarding the other asset classes, however, housing looks increasingly bullish, and is relatively defensive in the current context, so I don't think there is much to fear in real estate. And, equities certainly could decline, maybe even enough to become a legitimate bear market, but it is possible that they won't decline precipitously. I think the jury is still out on that, though whatever the indexes do, this will likely be a trader's market for a while. At some point, beaten down stocks will present long opportunities.
Fed Funds And 10 Yr Yields June 2004-Present  Fed Funds And 10 Yr Yields June 2004-Present
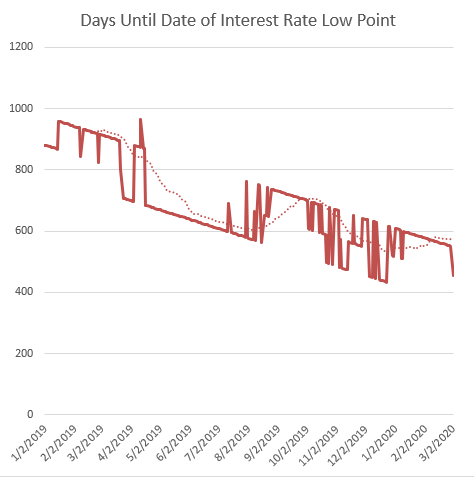
That relates to one bright spot in this month's update. The yield curve has been inverted at the short end since early 2019. The date of the expected rate low point had been September 2021 for a while. As the last chart shows, we seem to have been moving toward that date, suggesting that there has been enough momentum in the economy to get back to a normal yield curve eventually. But, the curve has been flattening lately, and it looked like it might tip back to December 2021 or even March 2022, which would suggest that we aren't really moving closer to a normal yield curve and that, as with the periods between QEs, more Fed loosening would be necessary to kick rates up over time.
Days Until Date Of Interest Rate Low Point  Days Until Date Of Interest Rate Low Point
But, with the corona virus dust up, even though yields have dropped down significantly, much of that has been at the short end. In other words, markets expect the Fed to react. So, even though most indicators in the past week have been negative, the yield curve has actually tilted up a little bit, and now the rate low point has moved to June 2021. In other words, the negative thesis has probably been confirmed (We will proceed through a standard yield curve related contraction.) but as we proceed through the contraction, the market expects the Fed to be nimble enough to prevent it from being too deep or long-lasting. I hope that's the case.