|
|---|
Hope you all are doing well and good and enjoying the best days of your life. This is me @shahid2030 from Pakistan and you are here reading my post. You all are welcome here from the core of my heart.
This is my participation in a contest Mastery of Moving Averages and Fibonacci Retracements organized in SteemitCryptoAcademy by @crypto-academy.
What is the difference between a simple moving average (SMA) and an exponential moving average (MME)? Explain how each is calculated and their typical use in trading. |
|---|
These two are the technical indicators we use for the analysis of the market. They both have almost same functions.
A simple moving average (SMA) and an exponential moving average (EMA) are the moving averages used in trading to identify trend and smooth out price data. Let's have a look to these two, one by one.
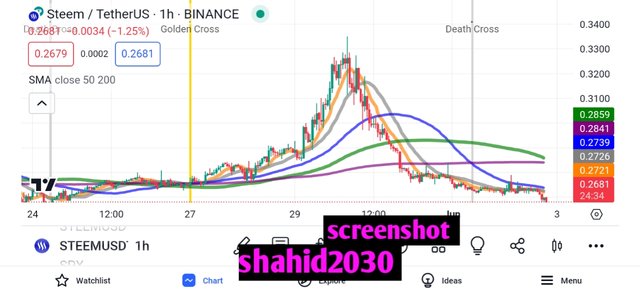
Simple Moving Average (SMA)
Let me show here the algorithm SMA works on. We calculate SMA by taking the arithmetic mean of a given set of prices over a specific number of periods.
Formula
It's formula is very simple:
SMA= P1 + P2+.....+Pn
__________________
n
Here P1, P2+.....+Pn are the prices at each period and ***n**** is the number of periods.
Example
Let's take example of 5 days chart. To find SMA of these 5-day , you sum the closing prices of the last 5 days and divide by 5.
Using SMA for trading
Trend Identification: The SMA always assets traders finding the direction of the trend. If we the price above the SMA level, it indicates an uptrend, while a price below the SMA show us a downtrend
Support and Resistance Levels: Support and resistance are the two most crucial levels in technical analysis. SMAs help us identifying both these levels. It can act as support or resistance levels where the price may find difficulty crossing.
Crossover Strategies: Many traders use SMA crossovers as their trade confrontation. e.g., They use short-term SMA and long-term SMA crossing as a buying or selling opportunity.
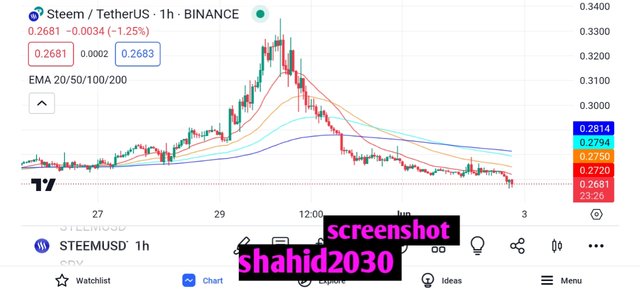
Exponential Moving Average (EMA)
The EMA gives more better response to the recent market's price. It helps the traders identifying the recent changes occuring in the market and gaining more new information.
Formula
EMAt = α .Pt + ( 1 − α ). EMAt−1
Here Pt means the current price, EMAt−1 is the EMA of the previous period, and 𝛼 is the smoothing factor, and it's value is calculated as:
𝛼 = 2
_______
n+1
n is the number of periods.
Example: For a 10-days EMA, the smoothing factor 𝛼 would be:
2
α= _______ = 0.1818
10+1
Using EMA for trading
Trend Identification: Same as SMA, the EMA helps us identifying trends too. It reacts more quickly to change in prices. It's a good tool for finding short term trends.
Signal Generation:
The EMA is often used in strategies when a faster reactions to price changes are crucial, such as in crossover strategies with faster EMAs compared to slower EMAs.
Key Differences between SMA and EMA.
| Simple Moving Average (SMA) | Exponential Moving Average (EMA) |
|---|---|
| It is said to be less sensitive to market recent price changes. | This is more sensitive to market recent price changes. |
| Very slow to react to new price information. | Faster to react, which helps traders in volatile market. |
| It is more lag due to equal weighting. | EMA is considered to be less lag, because it places more emphasis on recent prices. |
| SMAs are typically used by long-term traders and investors in the market. | EMAs are preferred by short-term traders and investors. |
Explain what a 'Golden Cross' and a 'Death Cross' are in the context of moving averages. How do these setups influence trading decisions? |
|---|
In technical analysis the terms Golden Cross and Death Cross refer to particular phenomena which is formed by moving averages. These patterns are considered significant indicators of potential market direction. Many traders use it to make decisions about buying and selling stock.
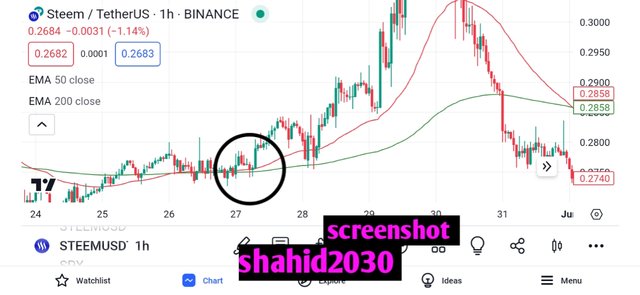
Golden Cross
A Golden Cross is formed, when a short-term moving average crosses a long-term moving average in above direction. The most common moving averages we used are the 50 days moving average (short-term) and the 200 days moving average (long-term). In simple words when a 50 days moving average crosses 200 days moving average in upward direction, we called it Golden cross.
How it works? This crossover is generally seen as a bullish signal or up trend confirmation. It suggests that a potential uptrend is on the horizon. Golden crossover actually means, that the momentum of the asset is gaining strength, and it maybe a high time to buy or go long position.
If the short-term moving average remains above the long-term moving average for enough time, this is a confirmation of the start of a new uptrend.
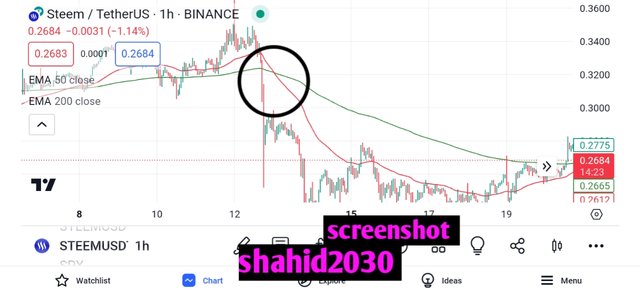
Death Cross
Death Cross is completely in contrast to that of Golden crossover. It occurs when a short-term moving average crosses a long-term moving average in below direction. Here we have the same moving averages; the 50-day moving average and the 200-day moving average.
How it works? The death crossover is generally seen as a bearish or selling signal. It indicates that a potential downtrend is coming. It tells us that the momentum of the asset is weakening, and it maybe be a good time to sell or go short your position. If the short-term moving average remains below the long-term moving average, it's the confirmation of the trend reversal, a new down trend will start.
Influence on Trading Decisions
•Golden cross is interpret as a signal to buy. It suggests a shift in momentum of buying pressure, which could drive prices higher.
• Traders observe Death cross as a signal to sell or short the asset. It suggest a shift in momentum of selling pressure, which could lead decrease in price of the commodities.
• Both Golden and Death Crossover gives sometimes false signals, especially in volatile or sideways markets. It is because the price fluctuate and it doesn't give us a clear trend.
• Moving averages are lagging indicators. They give us data based on past price of the market.
• For a valid and more reliable conformation, the traders must look for additional confirmation from other technical indicators too. It's solo analysis can't give us a full confirmation of the market.
Give a real-life example where Fibonacci retracements can be used to determine support and resistance levels on a trading chart. Use recent market data to illustrate your point. |
|---|
Fibonacci is a famous trading tool we use for finding retracement levels at market. The golden retracement levels of Fibonacci are; 0.382, 0.5 and 0.618. These three levels are so much important in Fibonacci and we mostly trade according to these levels. These levels may act as a support or resistance, depends on the current market and price movement.
Let me first give a short definition of support and resistance levels then I will show a live chart of Fibonacci tool.
Support: This is a level where the traders are sure that the price will not go below this level and, if price touch this point it will go upward direction. In other words words, Support is a strong buying zone.
Resistance: This is quite contrast to Support. Here the traders are sure that price will not cross this level and after touching it price will get dump. The is the strong selling zone we have.
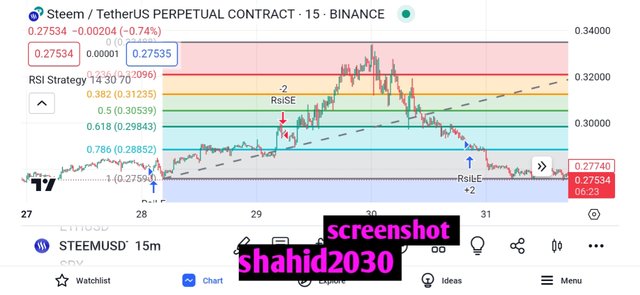
Fibonacci on live chart (STEEM/USDT)
This is the Live chart of STEEM/USDT pair on 15 minutes time frame. On this chart we see first retracement at 0.618 level. Price has tried to break it in upward direction, but it got retracted from that point. After retracement we see a break through in upward direction which is the indication of uptrend. Above 0.618 level we see some small retracements too, but the price continue to go in upward direction.
In down trend we see first retracement at 0.5 level which is a huge and valid retracement. After retracement price still continue going in downward direction and we see another retracement at 0.61 level. The price has taken some other small retracements and finally penetrated 0.61 level in downward direction. In short term, Steem is currently in down trend. This is short term or intra day trading analysis of STEEM because I have used 15 minutes time frame.
Design a trading strategy using both EMA and Fibonacci retracements. Describe your approach to entering and exiting a position, as well as risk management. |
|---|
This trading strategy of Exponential Moving Averages (EMA) in combination with Fibonacci retracements, help us to identify potential entry and exit points. The EMA helps in understanding the current market trend, while Fibonacci retracements focuses on potential levels of support and resistance.
EMA (Exponential Moving Average)
We use two EMA periods; 50 day and 200 days. If 50 days EMA line is above 200 days EMA line it's an indication of uptrend. While in downtrend 50 days EMA line cross 200 days EMA line. We go for short position in such case.
Fibonacci Retracement Levels
These are the key levels: 0.23, 0.382, 0.5, 0.618, and 0.786 which tell us about support and resistance in the market. It help us identify the best retracement levels in the market.
Let's see these both in combination.
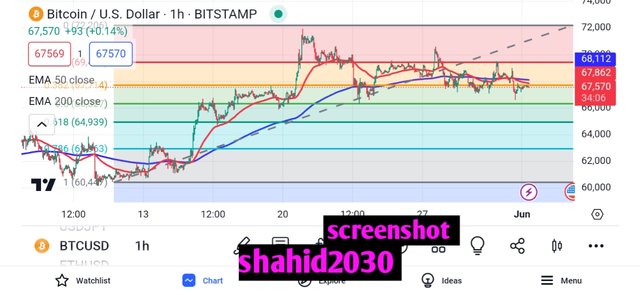
This is one hour chart of BTC/USDT pair. We can see near $61k level 50 days EMA has crossed 200 EMA level in upward direction. It results in the form of uptrend, which lead BTC to $72k level. Now our entry point should be at 0.786 Fibonacci level when the price crossed it in above direction after a valid retracement.
BTC up move continued and we saw another retracement at 0.5. BTC came back to 0.618 level. 0.5 level acted as a resistance and 0.618 behaved as a support level here. These are the golden Fibonacci levels. Here our entry point could be 0.618, which worked as a support and we can see a valid retracement from this point.
However, at 0.382 level we can see another minor retracement. Our entry point could be 0.5 after the retracement has been done. We can see the market has continued it's uptrend and it reached to the all time high of almost $72k level.
Let me mention again which levels could be best for taking long position. *** First is 0.618 level, we have double confirmations here; one is from EMA, because 50 days EMA is already above 200 EMA and second is from Fibonacci. Another could be 0.5 level of Fibonacci for long position. We could take entry at 0.382 level too after it's break out in upward direction.***
Currently BTC is in down trend and we can see retracement toward 0.5 or 0.61 level. These two levels could be a strong support for BTC.
Risk management
The best risk management is to calculate risk reward ratio. It should be minimum upto 1:2. If you have 1:5 your are a middle category trader while 1:10 is considered as the highest risk to reward ratio which only high experts posses.
I will wait BTC to come and touch 0.61 level, which is at $65k somewhere. I will put my stoploss below 0.618 at $64k and my first TP would be at $68k, second at $70k, third at $74k and fourth at $78k.
Analyze a historical trading chart of STEEM/USDT pair where a 'Golden Cross' followed by a Fibonacci application led to a significant price movement. Explain how you would have negotiated this scenario. |
|---|
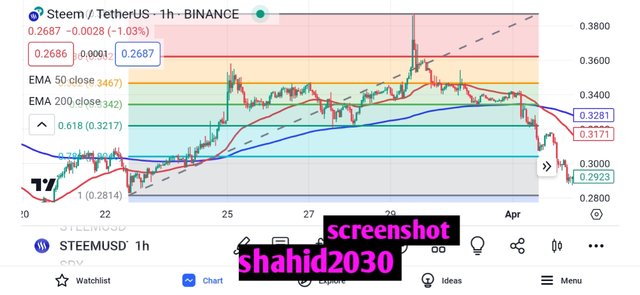
This is the one hour time frame chart of STEEM/USDT pair. Here we can see a Golden Cross, which lead to upward movement in STEEM's price. Here Fibonacci tool also has given us some important support and resistance levels. Here in this chart we can see the first retracement has taken place at 0.236 level. The price come down to 0.5 level and it acted as a support. We see a small retracement here.
The price is then able to break this support level and a new support at 0.61 level is made. This acted as a strong support and we can see a huge steep upward movement of steem.
Now what should be our trading strategy, according to this chart. We already new that we have a golden crossover here, which indicates that we are in uptrend. Now at all our support level Fibonacci shows us we will go for long position and and sell at resistance levels. This is for Short term or day trades. Long term traders may hold their position until 50 EMA line cross 200 EMA line in downward direction.
This is the past chart of STEEM/USDT, which perfectly follow the Golden crossover phenomena and Fibonacci has given us best support and resistance levels.
This is all about my blog for today, hope you guys have enjoyed reading it. See you soon with a new amazing and interesting topic, till take care.

| I would like to invite: @msharif @cive40, @jasa107, @miyexi, @kouba01, @nathalidelgado, @emsonic, @elrazi, @safridafatih, @hotspotitaly to participate in this Contest |
|---|
Your presence here means alot
Thanks for being here
Regard shahid2030

Thank you, friend!


I'm @steem.history, who is steem witness.
Thank you for witnessvoting for me.
please click it!
(Go to https://steemit.com/~witnesses and type fbslo at the bottom of the page)
The weight is reduced because of the lack of Voting Power. If you vote for me as a witness, you can get my little vote.
Downvoting a post can decrease pending rewards and make it less visible. Common reasons:
Submit
Upvoted. Thank You for sending some of your rewards to @null. It will make Steem stronger.
Downvoting a post can decrease pending rewards and make it less visible. Common reasons:
Submit
@tipu curate
Holisss...
--
This is a manual curation from the @tipU Curation Project.
Downvoting a post can decrease pending rewards and make it less visible. Common reasons:
Submit
Upvoted 👌 (Mana: 1/7) Get profit votes with @tipU :)
Downvoting a post can decrease pending rewards and make it less visible. Common reasons:
Submit
Please let me first inhale all this knowledge from you.
Probably you're a master in this brother.
I do love your presentation as it very much knowledgeable and educative.
Look at me, I'm now open to more advance level of the technical analysis.
I can properly apply my EMA AND SMA to charts and perfectly analyze market to favor and generate profits.
Good one sir keep it going and I'll be please to Learn more from you.
Downvoting a post can decrease pending rewards and make it less visible. Common reasons:
Submit
Thank you so much my dear friend for giving me so much hope and appreciating my work. God bless you dear.
Downvoting a post can decrease pending rewards and make it less visible. Common reasons:
Submit
Such a very powerful post friend, I will say it is obvious that you spent a lot of time and you put in a lot of handwork to come out with this such interesting output as an entry.
Yes friend on like the golden Cross that give traders with bullish signals or trend, the Dead cross is a sign of a potential bearish trend. With the help of order technical indicators you would understand how to generate perfect signals from this technical tools
Friend do well to comment on my entry
https://steemit.com/hive-108451/@starrchris/steemit-crypto-academy-contest-s18w2-mastery-of-moving-averages-and-fibonacci-retracements
Downvoting a post can decrease pending rewards and make it less visible. Common reasons:
Submit
Thank you so much my dear friend for your beautiful comment. Keep blessing bro.
Downvoting a post can decrease pending rewards and make it less visible. Common reasons:
Submit
Your comprehensive description of core concepts are enlightening.
That's true, they really help traders see trends more clearly by averaging out the price data. Both indicators are essential for understanding market direction and reducing short-term price fluctuations.
You are correct, long-term investors prefer SMAs because they respond more slowly to price changes, making them stable. This stability is useful for identifying broader market trends over longer periods.
Oh yeah, many traders look at the Golden Cross as a strong buy signal because it shows a potential uptrend. It indicates that a market is gaining upward momentum, suggesting a good time to enter a long position.
That's a good point, knowing your risk to reward ratio is crucial for making smart trading decisions and managing losses. It helps traders set realistic targets and avoid unfavorable trades, ensuring better long-term success.
All the best.
Downvoting a post can decrease pending rewards and make it less visible. Common reasons:
Submit
Thank you so much buddy for a beautiful and brief comment here. Keep blessing.
Downvoting a post can decrease pending rewards and make it less visible. Common reasons:
Submit
Your enthusiasm for learning and exploring new strategies in the exchange market is truly inspiring. Your focus on the moving average and Fibonacci retracement strategy shows your dedication to maximizing profits and analyzing trends effectively. Keep up the great work, and all the best.
Downvoting a post can decrease pending rewards and make it less visible. Common reasons:
Submit