
Yesterday the bulls hit back. During my last update, I argued EOS was following an ABCDE correction within a WXY pattern. We were waiting for wave E to find bottom.
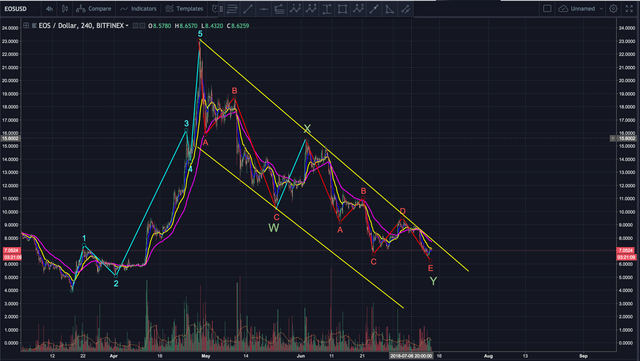
In my last update, price was consolidating on top of the $7.00 support. I said the market looked weak, and we should prepare for a further drop in price...possibly as low as the $6.00 support. Price did end up dropping, but found bottom at $6.50, where we had a very impulsive looking bounce as high as $7.23.
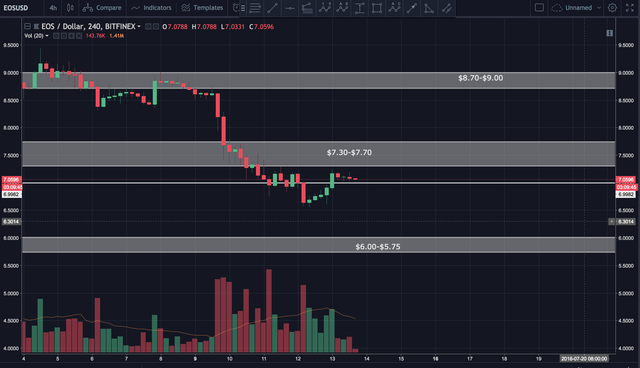
Price is now correcting, but the correction is healthy looking...at least so far. This looks like a text book wave 1 and 2. Probability tells us wave 2 is likely to reach the 0.5-0.618 fib level. However, we have strong support at $7.00, which coincides nicely with the 0.382 fib level. Due to this, I would look for a bounce between the 0.382 and 0.5 fib. There's a great deal of resistance to get past between $7.30 and $7.70. Volume needs to greatly increase if EOS is to break above. Should that happen, we may see a scenario that looks like this:
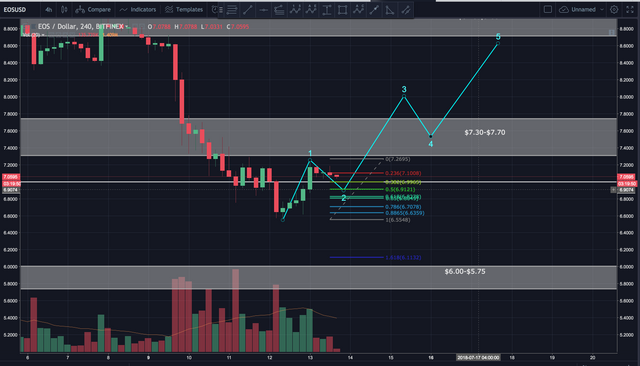
If price drops below the 0.618 fib, then we will likely test the prior low of around $6.50. This might set up a double bottom where we hit the low, and impulse up. However, if price drops below the $6.50 low, we may see it continue to the $6.00 support/demand zone.

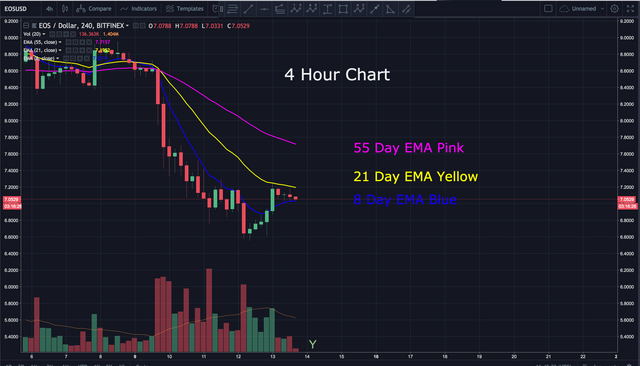
Looking at the 4 hour chart, price broke above the 8 day EMA and is now finding resistance at the 21 day EMA. This is a sign of short term strength. If price can break above the 21 day EMA, this latest rise may have legs. A decisive drop back below the 8 day EMA would be a sign of weakness and possibly invalidate my count above.
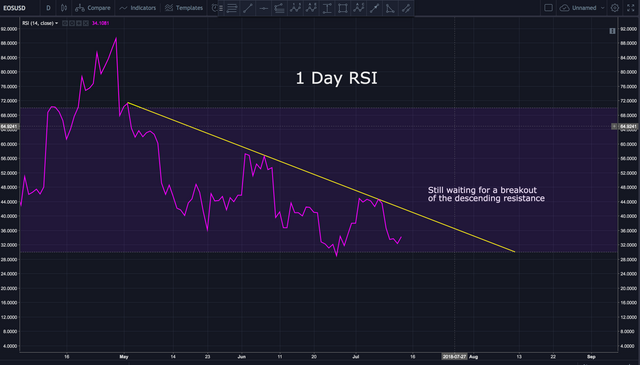
We’re continuing to watch the descending resistance line on the 1 day RSI. If it reaches that resistance line, we should be prepared for a drop. If it’s able to break out of the resistance, that would be another major sign of strength.
Watch my video analysis for MUCH more detail not found above.
Video Analysis:
BIAS:
Short Term: Slightly Bullish
Longterm: Bullish
I hope this has been helpful. I’d be happy to answer any questions in the comment section below. Until next time, wishing you safe and profitable trading!
Workin
If you found this post informative, please:

If you don’t have an account on Binance, I STRONGLY recommend getting one. They’re usually the first to get reputable coins, have excellent security and second to none customer service. Sign up here free of charge: https://www.binance.com/?ref=16878853
Brave is one of the safest, ad free browsers ever created. It helps support the crypto ecosystem by awarding content providers with BAT tokens. Join the revolution and download the latest version here, free of charge: https://brave.com/wor485
Follow me on Twitter (handle is @Workin2005) and Facebook to receive the latest updates. https://www.facebook.com/Workin2005
Published on

by Workin2005

really informative posts.
Downvoting a post can decrease pending rewards and make it less visible. Common reasons:
Submit
Thanks
Downvoting a post can decrease pending rewards and make it less visible. Common reasons:
Submit
Downvoting a post can decrease pending rewards and make it less visible. Common reasons:
Submit
Thanks @dulborah
Downvoting a post can decrease pending rewards and make it less visible. Common reasons:
Submit
Your posts are really helpful.
Downvoting a post can decrease pending rewards and make it less visible. Common reasons:
Submit
Thanks @pankuvirat
Downvoting a post can decrease pending rewards and make it less visible. Common reasons:
Submit
Downvoting a post can decrease pending rewards and make it less visible. Common reasons:
Submit
THANK YOU. USEFUL INFORMATION
Downvoting a post can decrease pending rewards and make it less visible. Common reasons:
Submit