The crypto total 2 marketcap is the crypto total marketcap excluding the BTC(Bitcoin) marketcap, simply put, it refers to the altcoin marketcap.
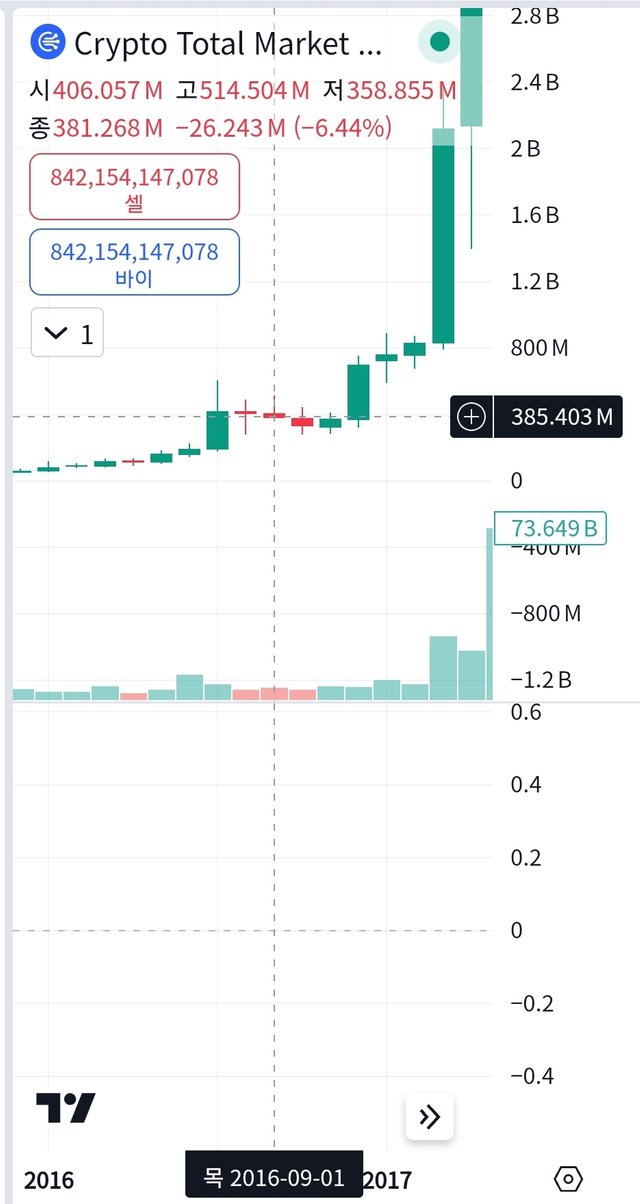
The reason why I want to analyze 2016 and 2020 data is, 2016 and 2020 are the BTC halving years. This year 2024 is the 4th BTC halving year. So, I want to analyze the tendency of BTC movements in September BTC halving years.
September 2016, the monthly candlestick of the crypto total 2 marketcap was a little bit bearish candlestick.
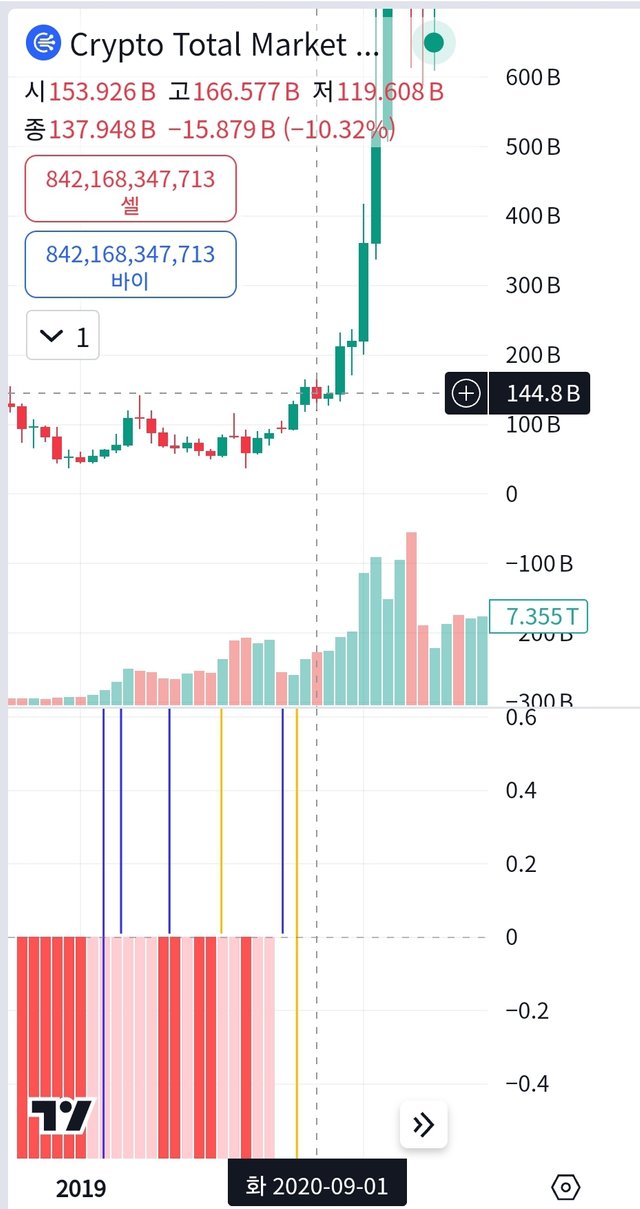
Alright, how about September 2020? It's a small bearish candlestick as well.
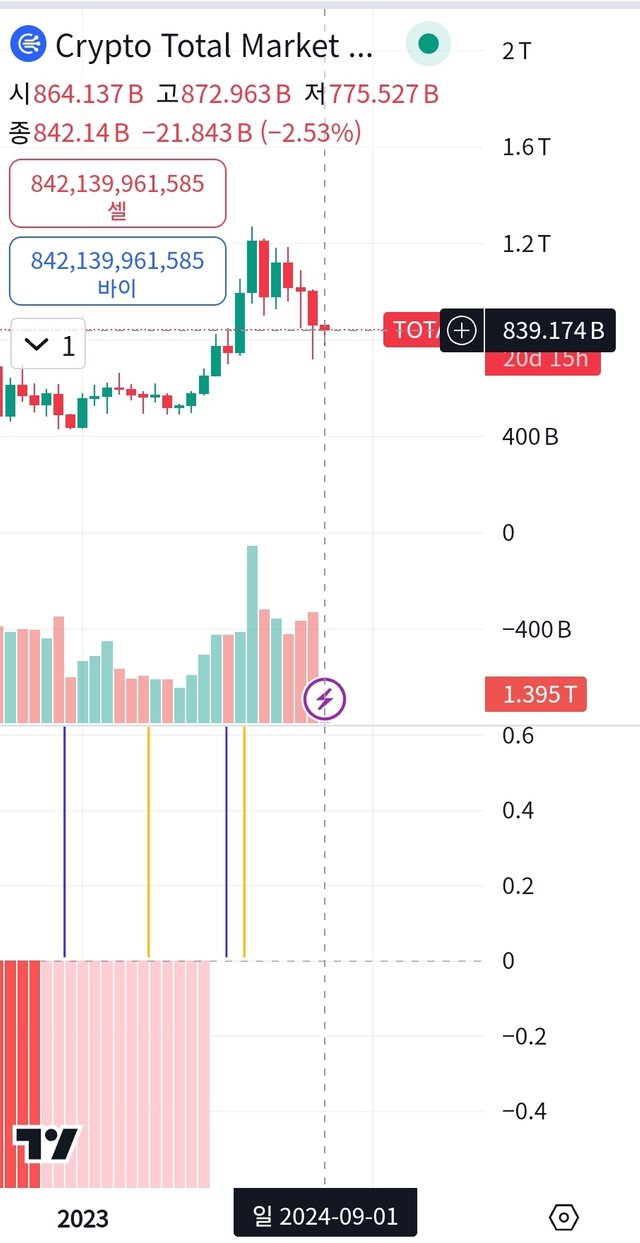
This month candlestick is still a red candlestick. So, I'd say it would be hard to change red to green.
However, if the crypto total 2 marketcap follows the past patterns, this month will likely be the last dip before the next 3rd altseason. I already buckled up.
Upvoted! Thank you for supporting witness @jswit.
Downvoting a post can decrease pending rewards and make it less visible. Common reasons:
Submit
"Loving the visual data insights here! 👍 Great job sharing these charts from TradingView, really helps to understand the crypto total 2 marketcap trend 📈💡 What's your take on this altcoin market movement? Share your thoughts and let's discuss in the comments below 💬"
I also gave you a 100% upvote for the delegations you have made to us. Increase your delegations to get more valuable upvotes. Cheers! 🎉
Help Us Secure the Blockchain for You
Your vote matters! Support strong governance and secure operations by voting for our witnesses:
Get Involved
Downvoting a post can decrease pending rewards and make it less visible. Common reasons:
Submit
good
Downvoting a post can decrease pending rewards and make it less visible. Common reasons:
Submit