

About Litecoin
Litecoin is a fork to a Bitcoin and from its starting point, it looked like a reaction to Bitcoin and for sure its architects exhibited it would have been the silver grade of the standard gold Bitcoin.
Litecoin picked a couple of signs from what Bitcoin was doing by then and updated on different them, hereafter gathering a further evolved and direct cryptosystem.
Litecoin has sent off a few elements to improve transaction speed and scalability. It can create 4 times the number of blocks as Bitcoin, 1 new block every 2.5 minutes when contrasted with 10 minutes with Bitcoin.
Litecoin utilizes Scrypt protocol, not the same as Bitcoin's SHA256 yet additionally works inside the proof of work consensus algorithm. Scrypt is accepted to be more secured and quicker than SHA256.
Moreover, the litecoin is less volatile compared to other altcoins. This makes trading very simple with the litecoin.
Price chart of Litecoin
.png)

Technical analysis about Litecoin
I would make technical analyses on both longer and shorter timeframes. It is always advisable to make a complete analysis before you enter into trade.
Analysis with 4-hour timeframe
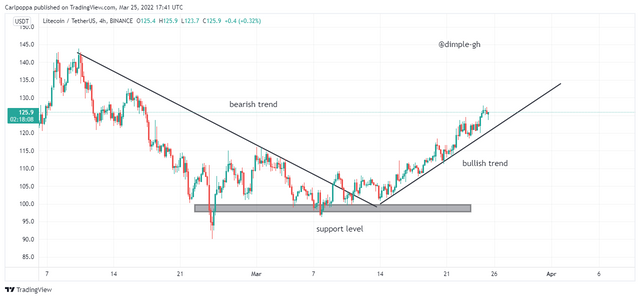
The four-hour timeframe is showing the end of and downtrend and the beginning of a bullish trend. According to the four-hour chart above, the price failed to break below the support level to continue the downtrend.
Before the bullish trend began, the price was ranging around the support level trying to accumulate some momentum before it pushes up in the bullish direction.
According to the chart above, we can confidently say the market is in a bullish phase.

Analysis with 2-hour timeframe
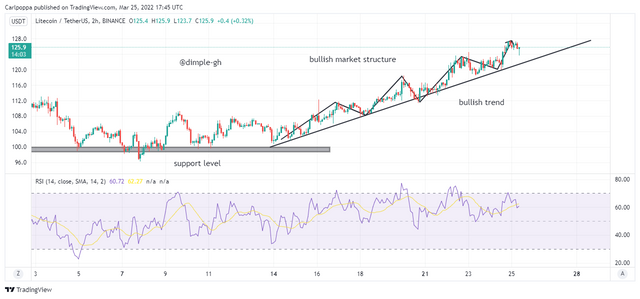
The two-hour timeframe also shows a bullish market structure with higher highs and higher lows being produced on the chart.
Movements of the line on the RSI also show bullish trend confirmation. The RSI line crosses above the middle (the 50 levels). This is another confirmation that the price is bullish.

Analysis with 45-mins timeframe
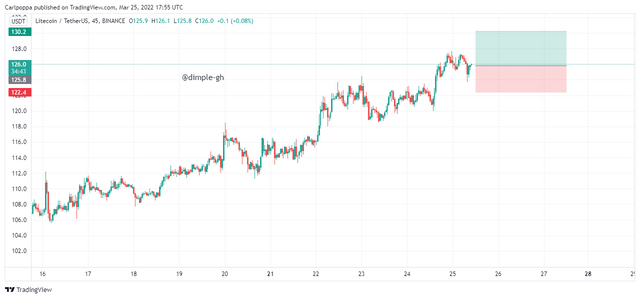
According to the chart above and the previous long-term charts, the litecoin is communicating bullish signals.
Here, we simply trade alongside the trend. Since the whole market is bullish, we just need to place our order after the price has retraced.
We place our stop loss below the higher low and place reasonable take profits somewhere above the previous high. Just as seen in the chart above.

Screenshot from meta trader
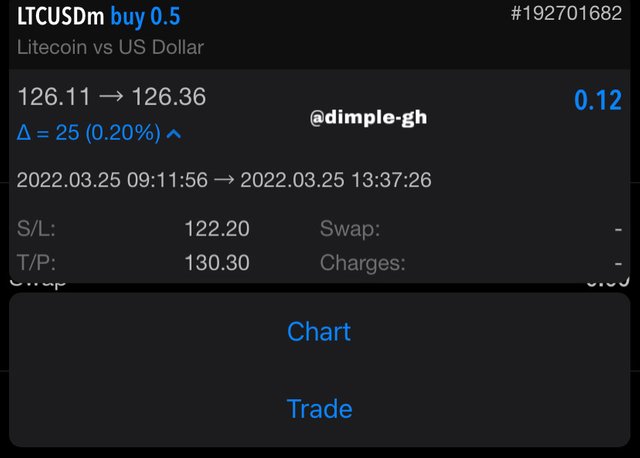
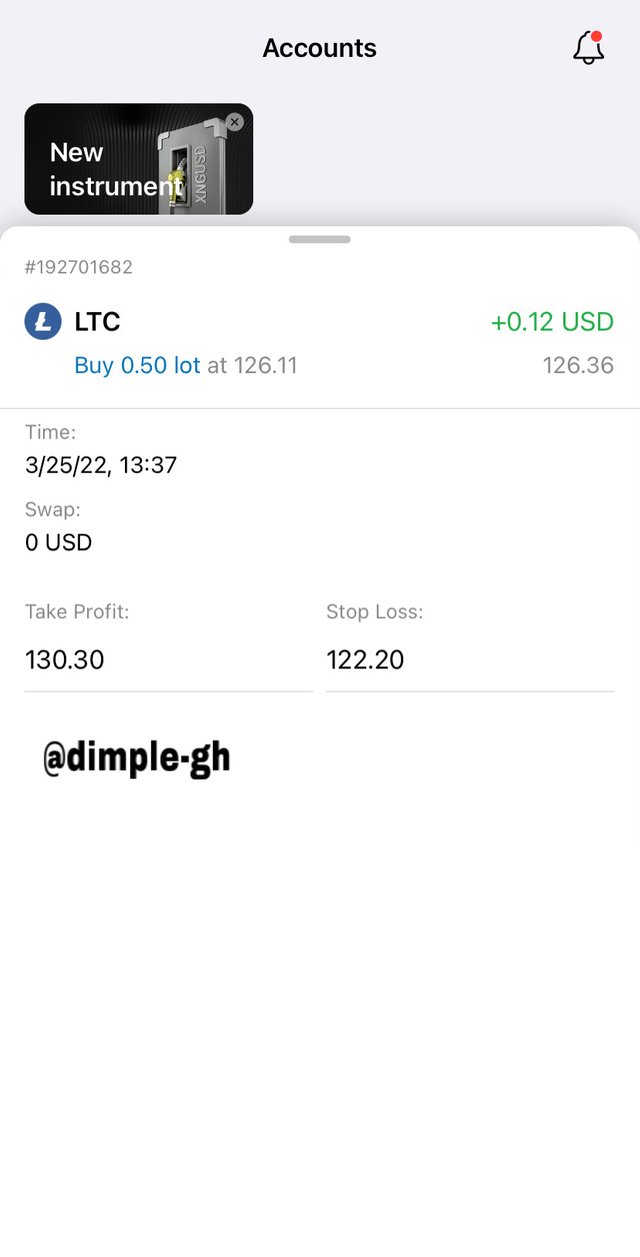
Trading in Exness broker account

Conclusion
Today, I made some good profits. I closed the trade as some few pips profits this is because I used good risk management. Talking from price movements, I could have made more profits if I had waited for take-profit.
However, the price could have retraced back to probably stop loss. That’s why is very good to take partial profits when necessary.
Upvotes removed
Downvoting a post can decrease pending rewards and make it less visible. Common reasons:
Submit
Why do you cure this? It is content from the academy, it will receive votes from SC02.
Downvoting a post can decrease pending rewards and make it less visible. Common reasons:
Submit