You are Highly Welcome to My Homework Post, That Was Given By Professor @utsavsaxena on the Topic "Head and Shoulders and Inverted Head and Shoulders Pattern.
1. Explain Head and Shoulder and Inverse Head and Shoulders patterns in details with the help of real examples. What is the importance of voulme in these patterns(Screenshot)
When it come to trading, there are different chart pattern in technical analysis that help traders to know the future direction of the price of asset that they are trading on. Literally, the patterns that are use are sub divided into some two group known as Continuationand Reversal chart pattern. Although today I will be discussing about Head and Shoulder and Inverse Head Shoulder Pattern. Let get started with the discussion below.
Eplaination of Head and shoulder Patterns
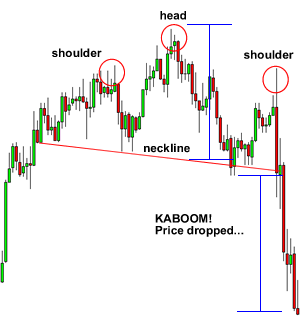
Head and shoulder Patterns are the type of pattern that do happens when an uptrend come to and end. It is very easy to spot using any timeframe. The head and shoulder pattern are formed by a peak, where the higher peak is the head, and a lower peak which is the shoulder. In other for the head and shoulder to be connected together, a trader need to draw a neckline from the left shoulder to head and it shouldn't be drawn horizontally rather the slop should either be drawn up or down. The down slop in the pattern provide a sell signal that is more accurate than the up slop.
The below screenshot is and example of the head and shoulder pattern.
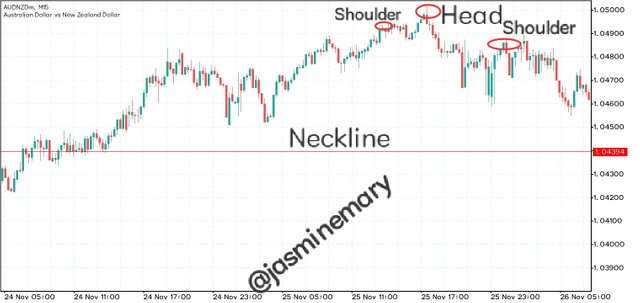
Looking at the above screenshot, we can see that the head is the second peak and also the highest in the pattern.The left and right shoulder also form peak but can not be above that of the head.
Eplaination of Inverse Head and shoulder Patterns
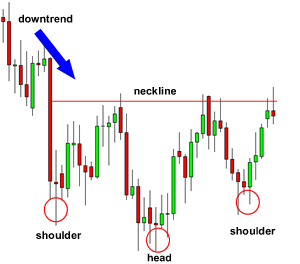
Firstly,if I may ask what is inverse? The what inverse simply means something that is opposite. This means that the Inverse Head and shoulder Patterns is precisely opposite of the head and shoulders pattern. It is the type of pattern that form a bullish trend reversal. It form a low shoulder, that is followed by a shoulder that is lower that it which is the head before another higher low shoulder which are form after a downward movement of the price if the asset.
Below is an example of the inverse head and shoulder patterns.
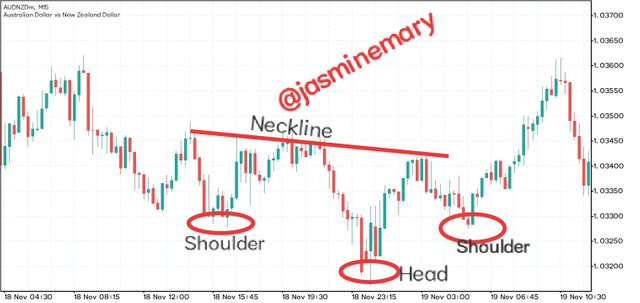
From the above screenshot, we can see that the Inverse Head and shoulder patterns look exactly like head and shoulder pattern, but flipped opposite.
What is the importance of voulme in these patterns(Screenshot)
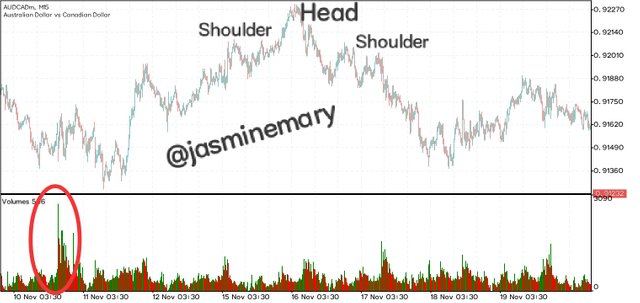
Volume is very important on head and shoulder pattern and inverse and shoulder pattern in their formation. Let's start by looking at the important of volume in the formation of head and shoulder pattern. The volume formation at the left hand side shoulder is important in the pattern as is show a high volume indicating that buyers are still in control of the market at the other side is and indication that buyers are gradually withdrawing out of the market. Although, when as the volume increases price will break above resistance.
Now looking at the important of volume in the formation of inverse head and shoulder pattern. The volume is also important but not as to be compare to how important it's in head and shoulder pattern as is it show sellers are withdrawing from the market. The reasons to why I say it's not as important to head and shoulder pattern is that it doesn't show traders when buyers are in control of the market. The volume at the right shoulder indicate a very small volume, and once the neckline breakout, a higher volume will be shown.
What is the psychology of market in Head and Shoulder pattern and in Inverse Head and Shoulder pattern (Screenshot needed)
The psychology of market in head and shoulder pattern is that at first when bullish trend weak to form a trend as the price of the asset becomes too high in the market at which the asset is currently traded, the bearish trend will then try to pullback the price.i.e making the price of the traded asset to fall.
Eventually, if the price of the traded asset falls and rise back,the left shoulder pattern will then be created.
In a situation when the left shoulder Patten is created, bullish trend will then try to make the price of the traded asset to get higher. With this a head pattern will then be formed. Although, the price cannot be hold for long in a high level by the bullish trend, because the bearish trend can easily make price if the asset to fall down, and when the price eventually fall down it will create a continuation and neckline.
Buyers try all possible best to pull the price of the price trade asset to a new higher-high. Although, the high cannot go above the head and it's at the right shoulder of the pattern.
Another psychology is that the bearish trend take over the market and make the price to pullback lower. Due to the strongness of the bearish trend they break the neckline. Although, the price of the traded asset might likely rise up again follow by a lower volume and get back to the neckline. When such a rise like this occurs it's and opportunity for traders to open a short position and place a stop loss that is above the neckline.
Below is a screenshot showing the psychology of market in head and shoulder pattern.
Psychology Market Formation of Inverse Head and Shoulders Pattern.
The formations of the inverse head and shoulder pattern occur following a downward movements. Its sell signal very accurate as I earlier said. Firstly, when the pattern is formed price cannot be in a bullish trend, instead it must be in a bearish trend which formed the left shoulder. The pattern is form due to the influence of sellers in the market that making the price to fall. Although, the influence of buyers which is more than that of the sellers makes the price to rise up starting from the neckline. At this point sellers takeover the price from buyers and a bearish trend will then begin.
At the inverse head that is created it indicates small volume, meaning buyers are withdrawing from the market. Buyers create a high that the neckline complete. This even with the creation of high neckline sellers will still make the price to fall. But in this case the price cannot be lower than the head, but if it's lower than the head a right shoulder will be formed making it the same with the left shoulder. At this point the best time that trader can open a buy order and set a stop loss and take profit is when the neckline is breakout.
Below is a screenshot of the psychology of inverse head and shoulder pattern.
3.Explain 1 demo trade for Head and Shoulder and 1 demo trade for Inverse Head and shoulder pattern. Explain proper trading strategy in both patterns seperately. Explain how you identified different levels in the trades in each pattern(Screenshot needed and you can use previous price charts in this question)
There are various strategies that one can use to trade for head and shoulder pattern. Here I will be looking at some of the vital strategies that we can apply.
The first strategy is for you to allow the pattern to be fully implemented. Once you have open your trade what you need to do is to patiently wait until the pattern is fully formed so at this point taking another trade is not good.
The second strategy is to place your sell order at a pips of 3 to 5 that is below the neckline
Another strategy is to set your stop loss and take profit at a pips that is above the neckline.
And finally to this let the price of your take profit be set separately between the head and shoulder neckline. Now let's look at a good example of the given strategy in a chart below.
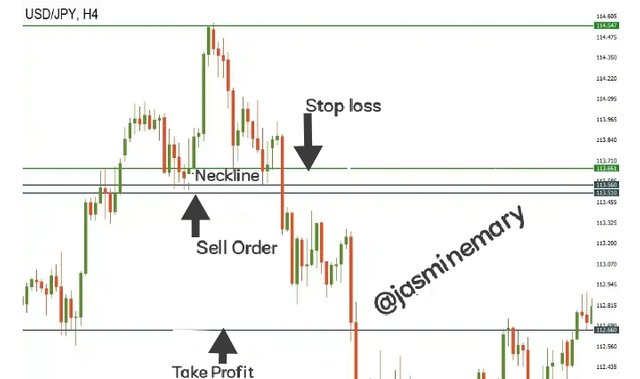
The above chart is a 4H chart of USD/JPY pairs. Now from the above chart, when looking at it carefully, the head and shoulder pattern is fully implemented. The price cannot be hold by the bullish trend when it is at 114.547 and the price fall below the neckline which is at 113.560. At this point a sell order can be open after the neckline has been break. And let the stop loss be set above the neckline at a price of 113.661, then take profit should be set at 112.660.
Inverse Head and shoulder
The same strategies that is used in head and shoulder pattern, can also be use for inverse head and shoulder pattern. Although, here you have to;
You have to allow a candlestick to break the neckline to the highest point.
The second strategy is to place your buy order at a pips of 3 to 5 that is above the neckline
Thirdly,set your stop loss and take profit at a pips of 3 to 5 that is below the neckline.
Finally,let your take profit be set different between the bottom of the and the neckline.
Example from the chart below.
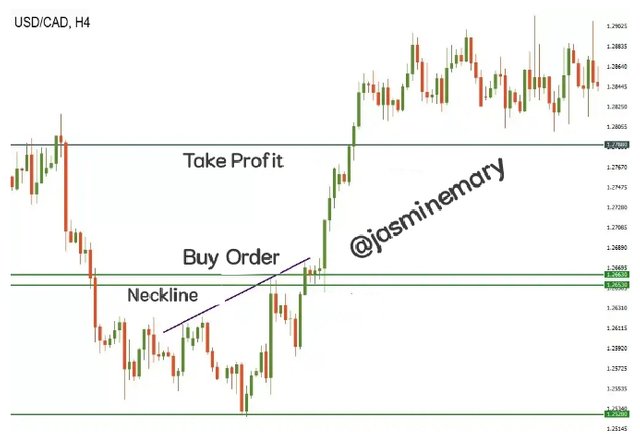
Looking at the above chart we can see that the neckline is not fully implemented like that of the head and shoulder pattern, but it slop is moving up, which is and indication that bearish reversal is likely to occur. At this point you can place your stop loss at 1.26530 and wait for the breakout of the neckline to occur. In a case where the candlestick is formed, you can open a long trade at 1.26630, and take profit at 1.27880.
4. Place 1 real trade for Head and Shoulder(atleast $10) OR 1 trade for Inverse Head and Shoulder pattern(atleast $10) in your verified exchange account. Explain proper trading strategy and provide screenshots of price chart at the entry and at the end of trade also provide screenshot of trade details.(Screenshot needed.)
At this, I went to TradingView chart and select a crypto pair of BNT/USDT on the chart. The market was in downtrend which a bearish trend at this point it is and Inverse Head and shoulder pattern. Based on the strategy that j gave above the first thing to look at is to wait for the candlestick to break the neckline to a highest point.
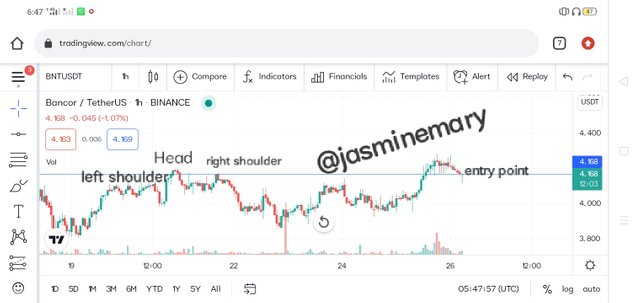
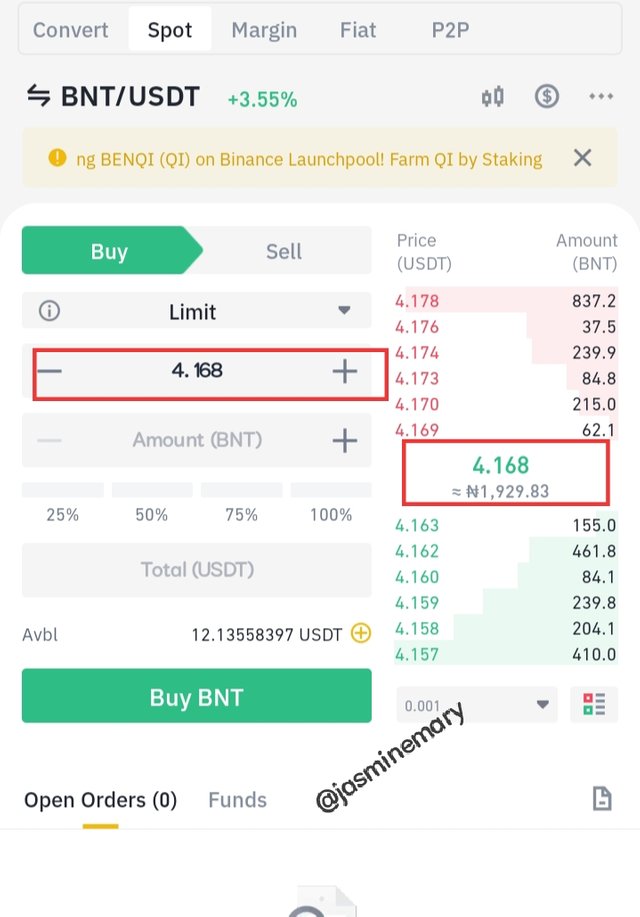
At this point I place my buy order above the neckline and wait for the price to breakout. As soon I have set my stop loss and take profit I then switched over to my Binance exchange and buy BNT/USDT at the current market price $4.168. The screenshot is shown below.
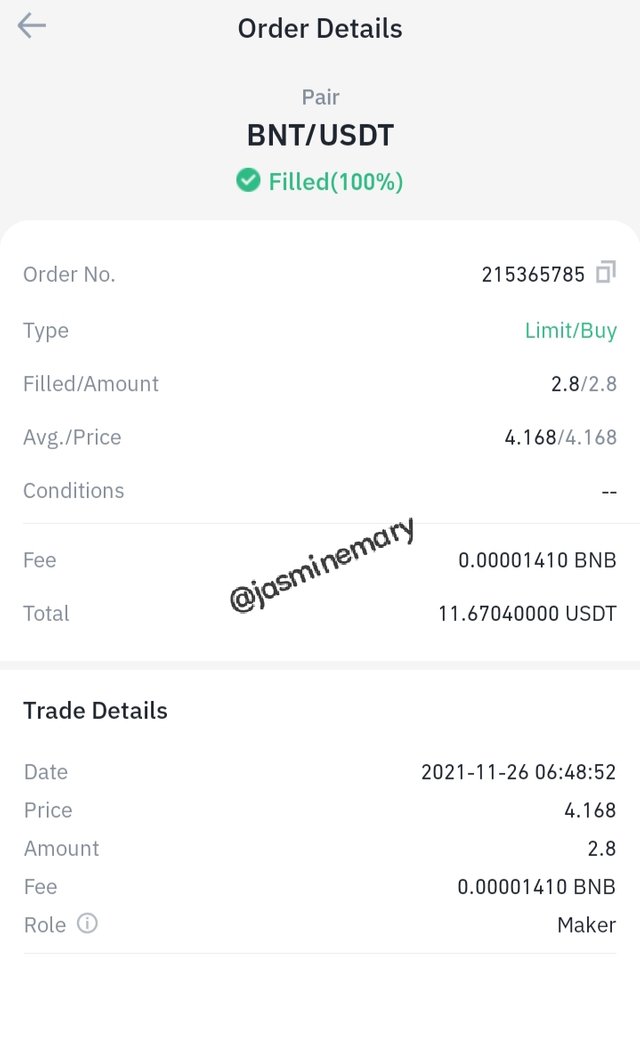
Below is the market order of the trade.
Conclusion:
The head and shoulders pattern and also the inverse head and shoulder patterns are types of pattern that is significant on the chart and its provides traders with the opportunity to make profit with limited risks involves. I sincerely appreciate professor @utsavsaxena for for his wounderfu and simple explanation to this lesson which is the backbone to this homework post.
Thank you so much my dear friend, for your time here.....
Best Regards;
Cc:-
@utsavsaxena
