Hello all friends, Today I am very happy to be able to follow the lecture delivered by professor @reminiscence01.
Previously, this was a continuation of last week's lecture which discussed an understanding of trends. But I forgot to post it and it's too late. Today we will discuss the second part of understanding trends.
 my design using picsart

Question 1
a) Explain your Understanding of Trend Reversal.

Every trend in the market must have an up or down movement. Where the trend follows the current market structure, and there will be a possibility of a reversal trend in a market.
A trend reversal is a formation on a chart that can alert us to a signal that the ongoing trend is getting ready to change direction or reverse direction.
When the market is reversing in an uptrend, it's called a bullish reversal, when it's turning in a downtrend, it's called a bearish reversal.
What is the benefit of identifying reversal patterns in the Market?
When we can identify a reversal pattern in an ongoing trend in a market, that's when we know that the trend will be down and we are ready to sell the assets we bought when an uptrend occurs.
When we know the trend is going up, we must immediately buy the asset and we can also see when we will sell it later because we can understand the trend pattern in a market, that's when we can profit when we know the trend will reversal

b) How can a fake reversal signal be avoided in the market? (Screenshot needed).

Now this is a false signal where there is a downward trend in an index, stock, or other securities that will certainly reverse direction.
False signals on this trend reversal are when the price goes up or when the price goes down, this is very dangerous. Once we are trapped, it will be a big loss that we will experience.
To be able to minimize the chances of getting caught in a false reversal signal. We can use the indicator that is usually used is the Stochastic RSI. So if we use the Stochastic RSI with overbought and oversold 80 and 20, we can minimize a loss or minimize us being trapped in the false reversal signal.
Take a look at the image below so you understand what I mean.
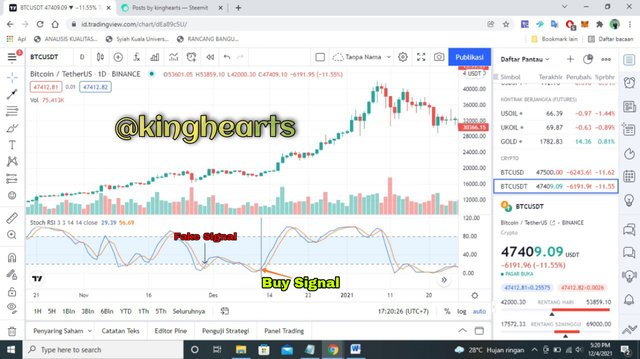 this is a screenshot of BTCUSDT taken from id.tradingview.com
 Now in the picture above we can see that when we use the Stochastic RSI with overbought and oversold 80 and 20, it is easy to avoid a false trend reversal.
On the Stochastic RSI indicator, when the oversold level exceeds the predetermined 80, there is a potential for a downward trend. On the other hand, if the oversold level is below 20, there is a potential for an upward trend.

Question 2
Give a detailed explanation on the following Trend reversal identification and back up your explanation using the original chart. Do this for both bullish and bearish trends (Screenshots required). Break of market structure, Break of Trendline, Divergence, Double top and Double bottom.

A. Break of market structure
Each market has an iterative structure, also formed between a maximum market and a minimum market which can also be created with prices between two different trends.
For an uptrend there is expected to be a price structure consisting of higher and higher maximums as well as higher minimums, where the price will result in several points that are also higher and higher on a chart and on the next minimum. couldn't even reach the minimum level before.
A break of a bullish structure will also occur when an asset has a lower high peak than the previous one, to occur then make a lower peak lower than the previous one, and make a break of the bullish structure to initiate a downtrend.
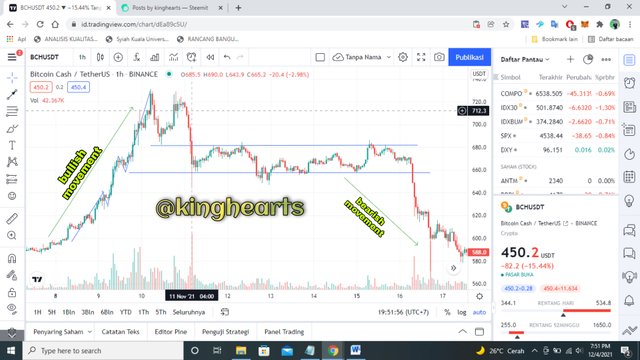 this is a screenshot of BCHUSDT taken from id.tradingview.com
 A down trend also has the same results as the explanation above, only for a downtrend it is the opposite, the structure is also a high and low trend which is also getting lower, the minimum resulting from will always be lower than where it was last created and the maximum cannot be exceeds the previous maximum level and is lower, if these criteria cannot be met, a trend reversal will occur
Then a breakdown of the market structure will also occur when an asset that also has a lower peak is higher than the previous one as well and the high peak exceeds the previous high peak and creates a breakdown of the bearish structure.
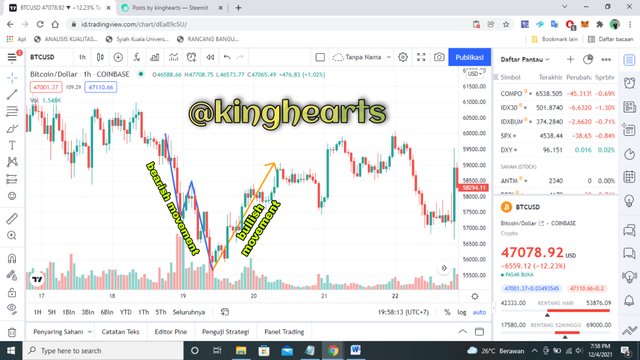 this is a screenshot of BTCUSD taken from id.tradingview.com
 B. Break of Trendline
A trend line is a straight line that can connect many points that are basically rising in a sequential manner and an uptrend condition, or the number of points of a peak, which is falling sequentially with a downtrend.
For a downtrend the line formed by the upper part of a price, has merged with a similar line at the lowest maximum and formed in pursuit of the market structure whose breakout indicates an uptrend reversal.
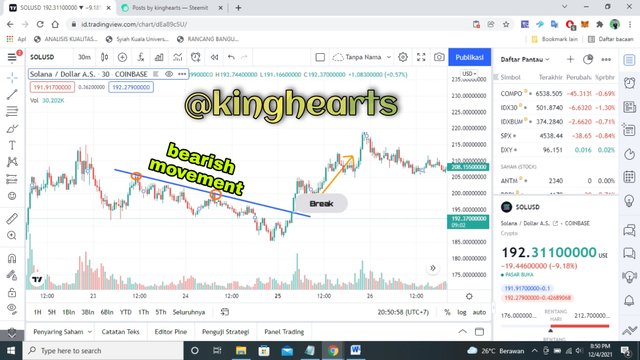 this is a screenshot of SOLUSD taken from id.tradingview.com
 For an uptrend, usually the trend line must be placed by combining two or more points evenly, where we must also have a low point and another high point to be able to place our trend line.
This will also be able to help us identify a price direction to go as well as support for it, where the asset may bounce back down.
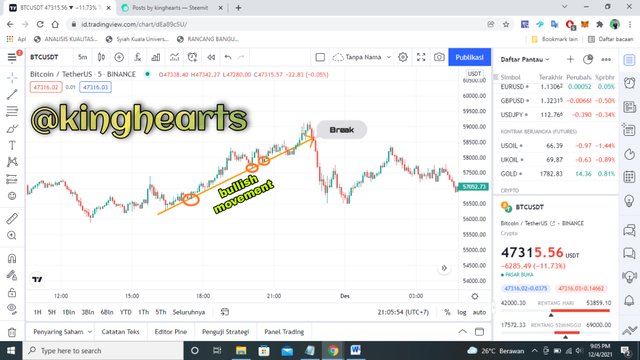 this is a screenshot of BTCUSDT taken from id.tradingview.com
 C. Divergence
When we are using an indicator, it is possible to find a pattern that will occur with a reversal with a contradiction and at the confluence of a price action and an indicator action. This is called divergence.
Divergences have also been known from various facts that occur that when the price is shown in a direction that will be different from that which the indicator itself will show.
When we know that bearish divergence the price action can also be seen to create a value with a higher and higher high or a low and a higher one, but on the appearance of the indicator it can occur or appear to make a position lower lows and lower highs too.
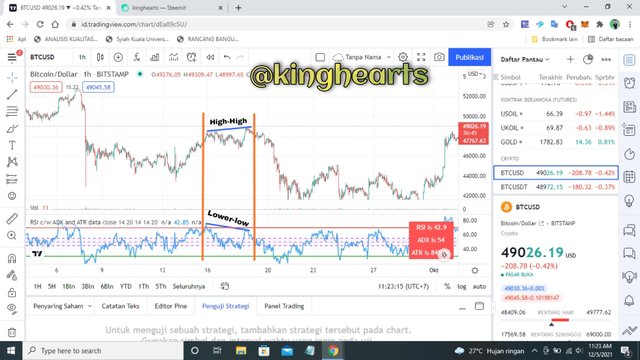 this is a screenshot of BTCUSD taken from id.tradingview.com
 When we know the bullish divergence will create a reverse, because in this case it will indicate the end of a descending trend. Well, actually we can see that an indicator shows us lows and highs and highs in an action for lower asset prices and this is what is called or signaled a trend reversal.
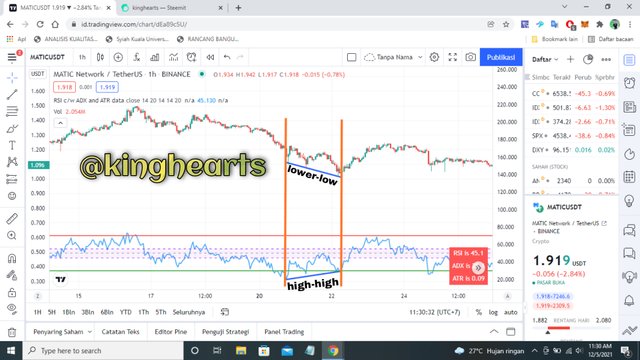 this is a screenshot of MATICUSDT taken from id.tradingview.com
 D. Double top and Double bottom
Double Top
In the discussion this is a reversal pattern in an uptrend, wherein the price has a point higher and higher than the previous one, and then also has a second high to reach the zone of the previous high, but it doesn't. would manage to go higher, but instead he would fall down due to exhaustion in the presence of purchasing power.
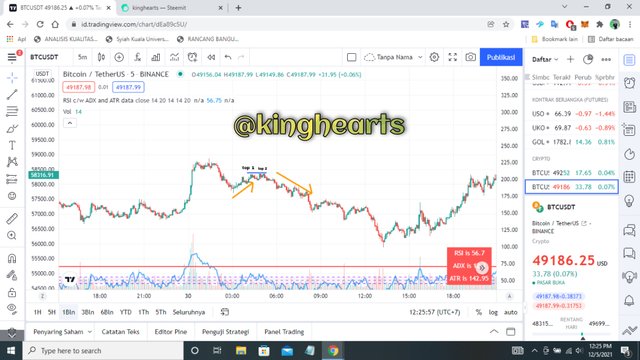 this is a screenshot of BTCUSDT taken from id.tradingview.com
 Double bottom
A double bottom is a trend that is formed in a downtrend, where at that time the price will have a lower low and then also have another lower low which can also touch the previous point, but he did not manage to make it at the lower low but will eventually bounce right in the area This is to get to the momentum that will be bullish.
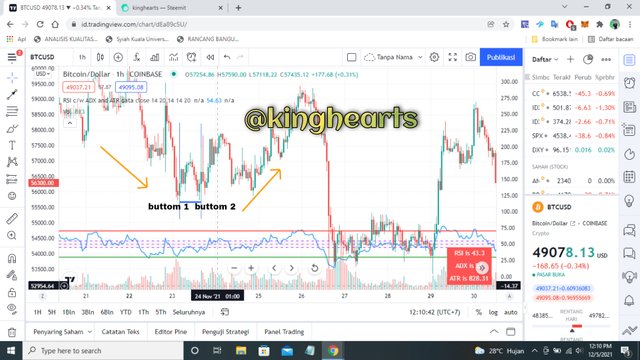 this is a screenshot of BTCUSD taken from id.tradingview.com
Question 3
place a demo trade using any crypto trading platform and enter a buy or sell position using any of the above mentioned trend reversal/continuation pattern.

using 5 minutes
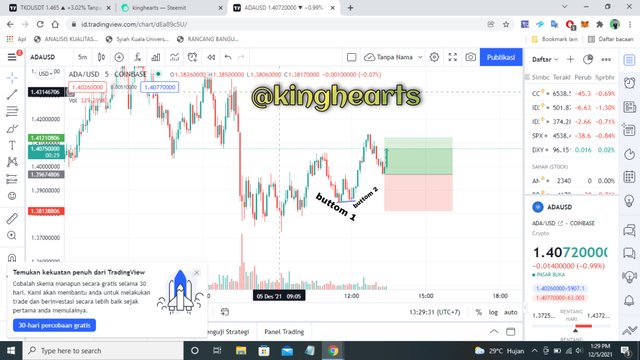 this is a screenshot of ADAUSD taken from id.tradingview.com
 Trending with a double bottom where a lower low was able to form, and then it has upward momentum in a retracement that eventually makes another low touch its previous low, but the candle fails to close below that point and doubles bottom created which will be a signal of a trend reversal. This is a good signal to place a buy trade and it can be seen that after the double bottom the price started to have upward momentum creating an uptrend.
here I show the results of the profit
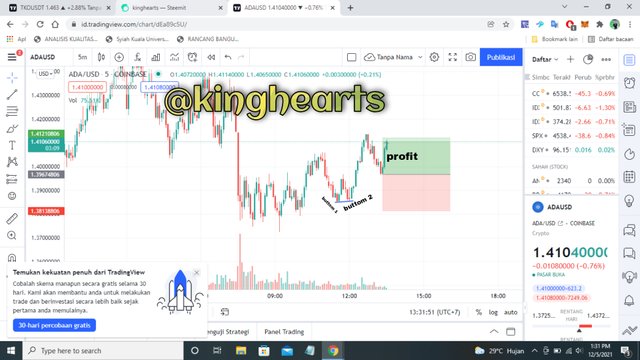 this is a screenshot of ADAUSD taken from id.tradingview.com
I am very happy to learn about understanding a trend, I can learn a lot of knowledge about it.
The market structure is also very important for us to be able to understand when an asset is trending, then also to be able to identify the break points in a trend structure.
Thanks For Visiting My Post
Best Regards
@kinghearts
Downvoting a post can decrease pending rewards and make it less visible. Common reasons:
Submit
Thanks you
Downvoting a post can decrease pending rewards and make it less visible. Common reasons:
Submit
If you are in club100, why are you using club5050 tag, @kinghearts?
Downvoting a post can decrease pending rewards and make it less visible. Common reasons:
Submit
because the rating says #club5050, if I don't use it, I don't think there is a value of "1"for the tag @devann , So instead of losing one point, I'll just use it
Downvoting a post can decrease pending rewards and make it less visible. Common reasons:
Submit
Hello @kinghearts, I’m glad you participated in the 3rd week Season 5 of the Beginner’s class at the Steemit Crypto Academy.
Unfortunately, you have submitted your work after the deadline which is 11:59 UTC on Saturday 4th November.
Remark: Homework Task Disqualified
Downvoting a post can decrease pending rewards and make it less visible. Common reasons:
Submit
Sory prof, I forgot to submit it, thanks you prof @reminiscence01
Downvoting a post can decrease pending rewards and make it less visible. Common reasons:
Submit