UNDERSTANDING TRENDS

1) a) What do you understand by a Trending market?
b) What is a bullish and a bearish trend? (screenshot required)
This tells us about the direction at which the price of the market is headed. Although not in a straight line but can be noticed in time that the zigzag trends or range is only a pattern retracement. The Market Trend is a result of the demand and supply caused by buyers and sellers. There’s an upward trend when the demand is more and a downward trend when sellers are more than buyers.
This is like a recovery period in the crypto world where we see an upward trend in the price of a currency which is caused by higher demand in the market. In a bullish market, we tend to see a formation of higher high and higher low which is as a result of the market failing to trade below the previous low-point and thereby closes above the previous high-point.
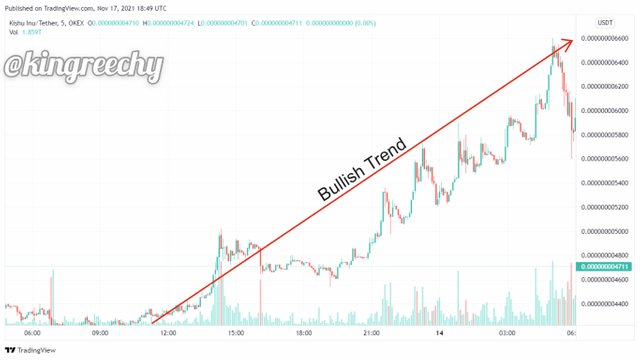
This is like a relapse period in the crypto space where we see a downward trend in the market price which is as a result of traders leaving the the market by selling off to avoid loss from falling prices. In a bearish market, we tend to see a formation of higher low and lower low which is a result of the market failing to close above the previous high-point and thereby closes below the previous low-point.
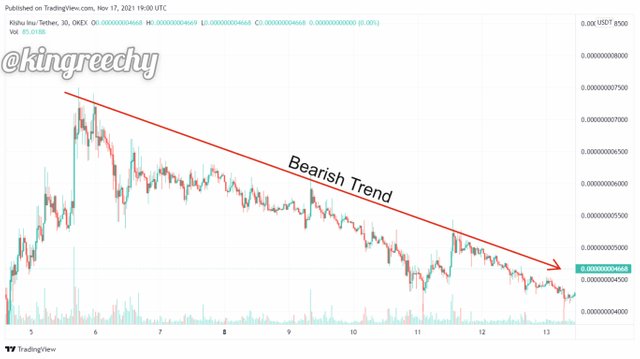

2) Explain the following trend identification and give an example of each of them. (Original screenshot needed from your chart). Do this for a bullish and a bearish trend.
i) Market Structure.
ii) Trendlines
This is a simple and basic way of understanding the current state of the crypto market. It is a visual representation of the support and resistance level displayed in charts which is an indication of an upward trend, downward trend or a ranging market.
Market structure is a trend following tool that traders uses in reading and following the movement of the crypto market so as to know when to come in and go out of a trade. There are three various kinds of Market Structure;
- Bullish Market Structure
- Bearish Market Structure
- Ranging Market Structure
BULLISH MARKET STRUCTURE:
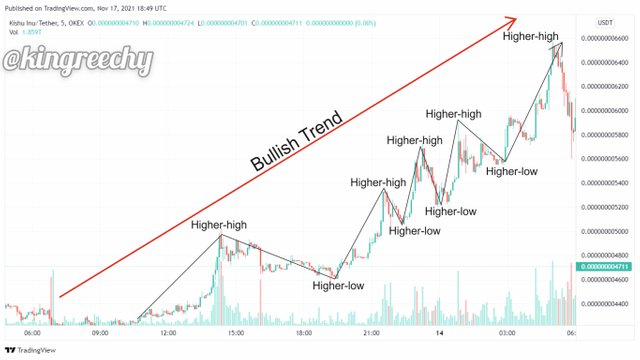
To identify a Bullish Market Structure/Trend, we take notice the market forming a Higher-high and Higher-low formation. An example of Binance smart chain Bullish Trend can be seen in the chart below.
BEARISH MARKET STRUCTURE:
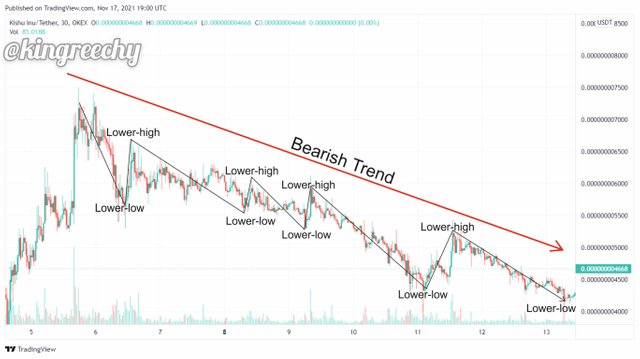
To identify a Bearish Market Structure/Trend, we take notice of the market forming a Lower-high and Lower-low formation. An example of Binance smart chain Bearish Trend can be seen in the chart below.
RANGING MARKET STRUCTURE:
To identify a Ranging Market Structure/Trend, we take note of the market fighting against the support and resistance areas without forming any trend. During a ranging market, prices fail to either create a new high or a new low. This phase is termed as an accumulation phase for either profit removal or build-up for a trend.
This is known to be another means of speculating the trend in the crypto market by the identification of two low points as an uptrend and two high points as a downtrend. Traders makes use of this representation to determine the direction of the market. There are two kinds of Trend lines namely;
- Bullish Trendlines
- Bearish Trendlines
BULLISH TRENDLINES:
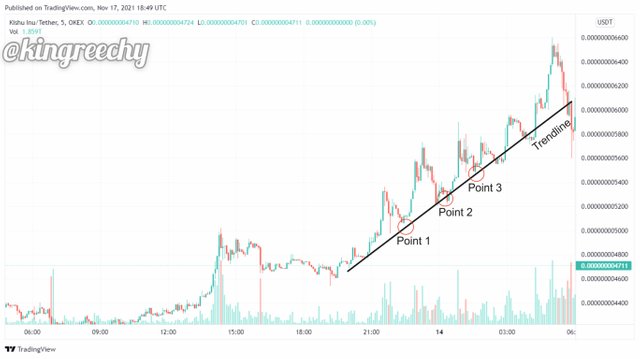
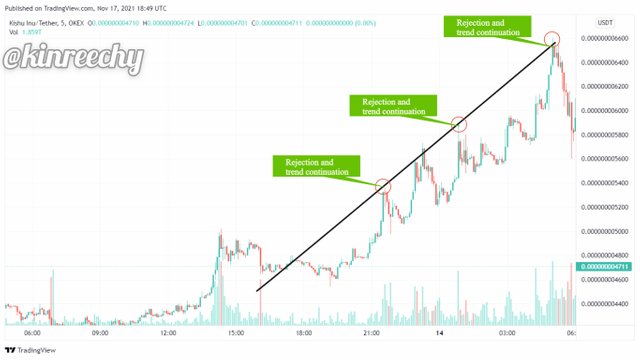
When we see the Trendlines trading at a higher price above the previous Trendlines we say the market has a Bullish Trendline.
An example of Bullish Trendline can be seen in the chart below.
BEARISH TRENDLINES:
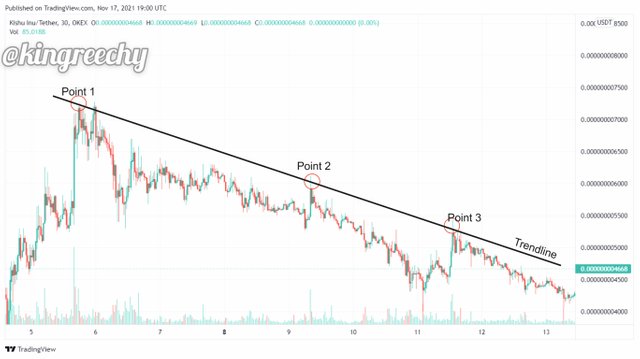
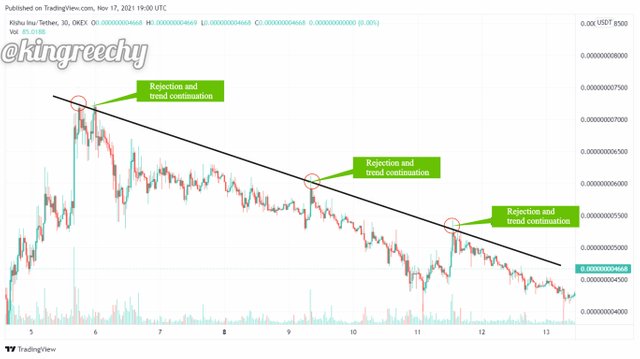
This is the reverse concept where we see the Trendlines trading at a lower price below the previous Trendline.
An example of Bearish Trendline can be seen in the chart below.

3) Explain trend continuation and how to spot them using market structure and trendlines. (Screenshot needed). Do this for both bullish and bearish trends.
The market doesn’t move in a specific direction but in a zigzag manner which leads to retracement in price which is as a result of traders taking their profit from the market in order for the price to continue in it’s initial direction. The knowledge of Trend Continuation enables us to know whether there would be a continuation or a reversal in movement. Below I will be explaining how to spot this movement using Market structure and Trend Line.
HOW TO SPOT TREND CONTINUATION USING MARKET STRUCTURE:
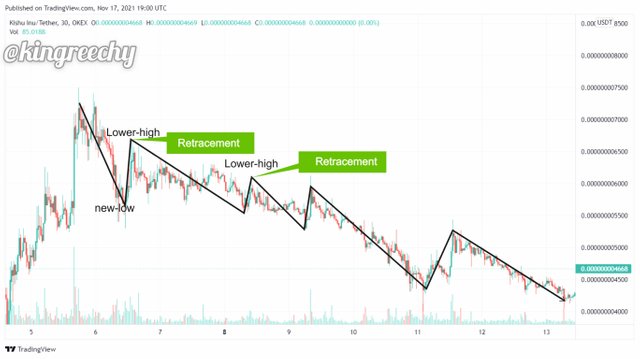
As earlier explained, through this means we understand the current state of the crypto market. We say there’s upward trend when we see a higher-high and higher-low formations in the price movement likes for a downward trend we see a lower-higher and lower-low formation in price movement due to buyers unable to push the price above the previous high. This is as a result of sellers being in dominance or the market.
For the bearish trend we notice a retracement which creates an entery point for traders to come in before the next impulsive spike in price. There are two key points to be taken here for a bearish trend.
The high point during retracement must not be higher than the previous high point.
The new low point created must be lower than the previous low point.
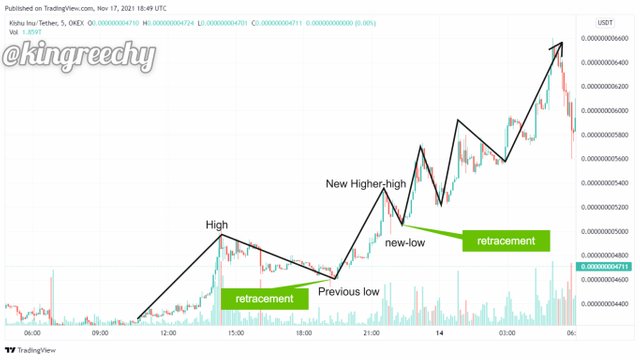
Similarly, for a bullish trend, the following criteria must be observed for a trend to continue in an upward direction.
The new low point during retracement must not be lower than the previous low.
The new high point during retracement must be higher than the previous high.
HOW TO SPOT TREND CONTINUATION USING TRENDLINE:
As explained earlier, it is a means of speculating the trend in the crypto market. The Trendline can either go in an uptrend otherwise knows as a bullish trend or a downtrend otherwise known as a bearish trend. Traders makes use of this representation to determine the direction of the market.
Below is a chart representation of a Bullish Trendline:
Below is a chart representation of a Bearish Trendline:

4) Pick up any crypto-asset chart and answer the following questions -
i) Is the market trending?
ii) What is the current market trend? (Use the chart to back up your answers).
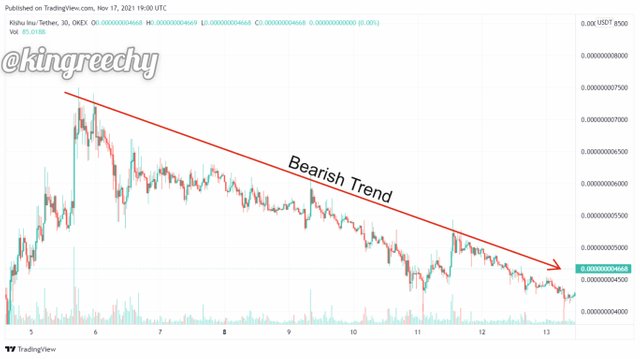
I. The below Market Chart is a typical Trending Market
II. The Below Market Trend is a downtrend which is a Bearish Market Trend due to the direction of the chart.

It is vital for everyone into crypto currency to understand Market Trend especially for those going into trading. Having learnt and understood the trends in the market, I can boldly teach my Steemit recruits how to understand the crypto market. Now I know how to perfectly describe or predict the movement of a crypto Asset.
I used Kishu inu coin because it is a good project and I believe it to be a good choice on crypto investment for the future.
Hello @kingreechy , I’m glad you participated in the 1st week Season 5 of the Beginner’s class at the Steemit Crypto Academy. Your grades in this task are as follows:
Recommendation / Feedback:
Thank you for participating in this homework task.
Downvoting a post can decrease pending rewards and make it less visible. Common reasons:
Submit
Thank you very much Professor, I will do better next week.
Downvoting a post can decrease pending rewards and make it less visible. Common reasons:
Submit