
INTRODUCTION .
Trading in global market requires skill. Just like every profession, profit is determined most times by experience and level of skill you have.
In crypto trading, those skills require understanding and applying knowledge due to exposure to various patterns and method of trading. Among the most pupular trading methods reversals are widely traded which convinces us of it's profitability. Aside from it's profitability, it is more easier to speculate.
"Explain your Understanding of Trend Reversal. "
Reversals refers to a turn in the movement of a trend.
Ordinarily, trends of asset can make an upward ( uptrend) movement, a downward movement (downtrend) or it can go sideways. A reversal refers to a change in direction of the price action of the analysed security.
What influences trend is buyers and sellers and what causes reversal is same. When there are more persons buying a crypto asset than there are more selling, the price will go up because the many buyers must have created scarcity of the asset. On the other hand when people selling are greater than buyers, the price goes down.
Reversals occur at every time the either side gain more dominance of the market.
For the interest of this assesment task, let me mention the two main reversals.
BULLISH REVERSAL.
A bullish reversal occur when the price was moving downwards and due to the influx of many buyers or the volume of their investment, the price start going up again breaking above the previous established low threshold. What happened are that there are more investment in the project than withdrawals. People are accumulating more of the coin and with few sellers, the price will then shoot up.
On the chart, we will notice a graphical upward movement after the downward slop. The chart gives us a graphical representation of price action.
BEARISH REVERSAL.
This is the opposite of the bullish. It occurs when price of an asset is in an upward movement dur to many buying. Now some who bought at a more cheaper rate must have made some profit and decide to withdraw their funds to take profit. When many are selling than those buying, the price will begin to go down and so the graph.
"What is the benefit of identifying reversal patterns in the Market?"
The key issue when trading Reversals is to identify when to open a position and when to take profit. How do you determine if a true reversal is happening or if it is just minor change in an asset direction? The answer to that question explains the benefit of identifying reversal partterns in the market.
Reversal patterns are market formations that can be observed on a chart. They equally include the very ones detected with the aid of a technical tool like the trendline. In other cases, technical indicators are used to established reversals and determine entry and exit positions.
The very benefit of identifying these pattern is to:
1• Establish when a true reversal is happening.
2• Determine when to open or exit a position.
3• Fish out false reversal signals.

" How can a fake reversal signal be avoided in the market? (Screenshot needed)."
To avoid false signals or fake reversals, we need some tools. Let's illustrate two.
1• USING TRENDLINE.
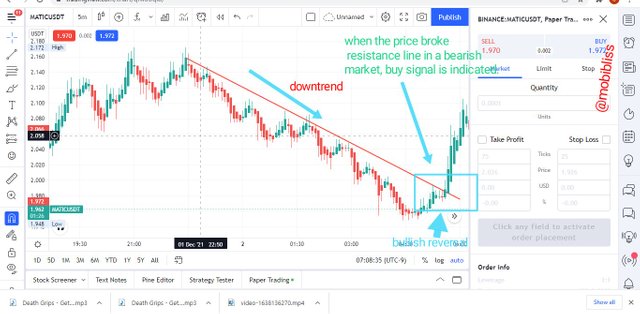
When a market is making a higher high and high low, it is in an uptrend, a break in that sequence would signal a reversal to a downward movement. Using a trendline to connect the downs together will help us fish out a false reversal. For example, when the price did not break the previous higher low may point to a fake reversal. With the aid of a trendline, we have not made a mistake.
In the above image, I have drawn a trendline connecting all the low points. With the trend line it will be easy to fish out when a real reversal is happening and when the reversal is a temporary change in price action.
The chart above is a sample of bearish reversal signal. As shown in the chart, reversal is indicated when the price chart broke support. When this criteria is not Metz then it is a false signal.
2• USING INDICATORS.
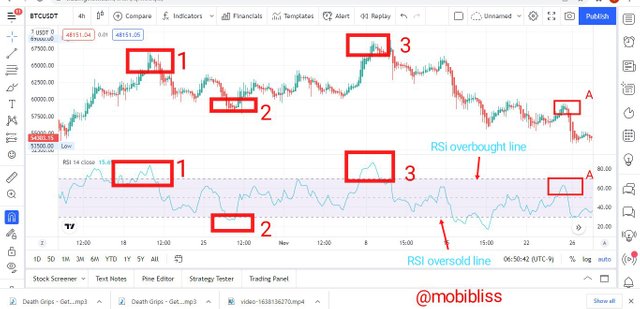
Using some indicators like the momentum indicators help us determine reversal points. For example, RSI help us determine overbought or oversold positions. When price is at these places, there high probability of reversal. Fake reversal is indicated when price reverses outside of these areas.
In the chart below I used RSI indicator, when price is above 70% area of the indicator, it signals overbought area, a possible bearish reversal cod be imminent. When the chart reached the 30% line of the indicator shows oversold position, and a possible bullish reversal is indicated.
In the chart below, I have indicated correct signals using the indicator in the areas with numeric labels. When the reversal do not meet the criteria, it shows a false signal like the area marked A.
Now let's see ways to identify reversals.
"Give a detailed explanation on the following Trend reversal identification and back up your explanation using the original chart. Do this for both bullish and bearish trends (Screenshots required)."
Break of market structure.
Momentum of a trend can be used to determine when a reversal occurs, this is easily noticable using a momentum indicator. In a simar way, market forms structures. This is a sequence of it's swing within a particular trend. Such swing corelate with the prevalent pressure and the momentum at which it accelerates.
In an uptrend for example, market makes higher highs and lower lows. The structure of an uptrend is that a current higher high should be greater than the previous higher high. Also current higher low, should be higher than the previous. A break in such structure and sequence should be an indication of reversal.
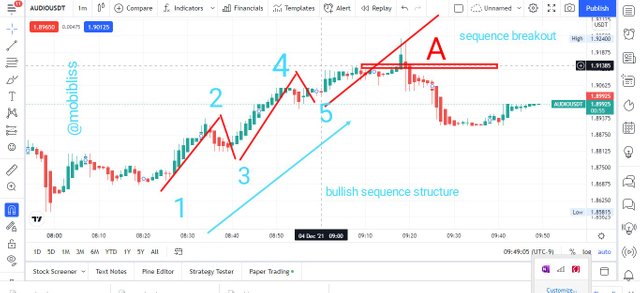
In the audiousdt chart above, you can observe a a bullish market structure, the sequence is invalidated when at the point marked A in the chart, when the market could not make further higher high but rather fall below support. When such occurs in a bullish setup, it indicates a market reversal to the bearish and then a trader will be looking for sell opportunity.
Same structure is observed on a bearish movement. Current lower high should be lower than the previous and the current lower low should be lower than the previous. A break in such sequence signals a change in momentum and that is an indication of reversal.
See image below.
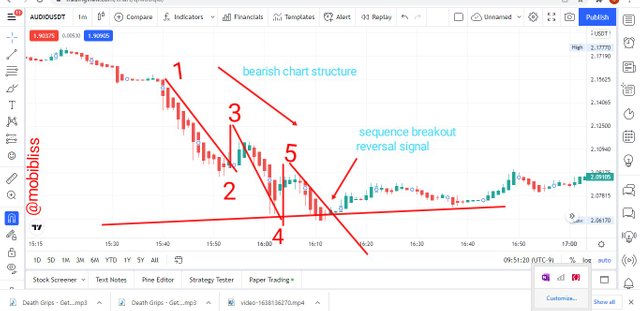
We can observe reversal at at the cross when the setup fast make further lower high but rose above the resistance line.
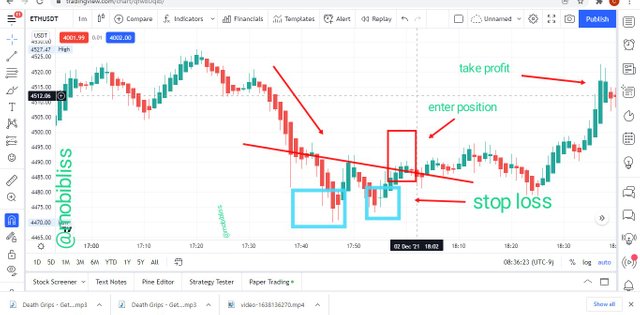
Break of Trendline.
Break in trendline is similar to the example I gave in the previous subtopic on a way to avoid false signal.
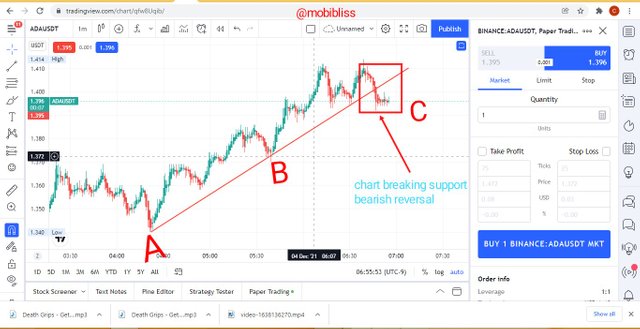
In an uptrend, a trend line is drawn below connecting all the lower points. A reversal is indicated when the price action breaks the support line which is the trendline points. Such break is an indicator of of a change in the current market pressure.
As I pointed out earlier, markets makes higher highs because of a buy pressure being higher than the selling pressure. A higher low signifies the battle by the sellers to gain dominance in the market. When a trend breaks the support line, it indicates a shift in dominance. It means that selling pressure is then higher than the buying pressure.
bearish setup.tradingview.com
In the image of ADAUSDT above, the uptrend came to an end when the price chart broke support line and move downwards.
Same is also the case in a bullish reversal. A trend line is drawn above the chart connecting all the high points in a falling market, a break of the resistance lines signifies a shift in dominance and an indicator of reversal.
See below image.
Divergence.
Divergence can be observed using an indicator like the RSI, a bullish divergence occurs when an asset price chart is making a higher high while the indicator is making a higher low. This signals a gradual change in momentum and an indication of a bearish reversal.
A bearish divergence occurs when an asset chart makes a lower high whereas the indicator makes a lower low.
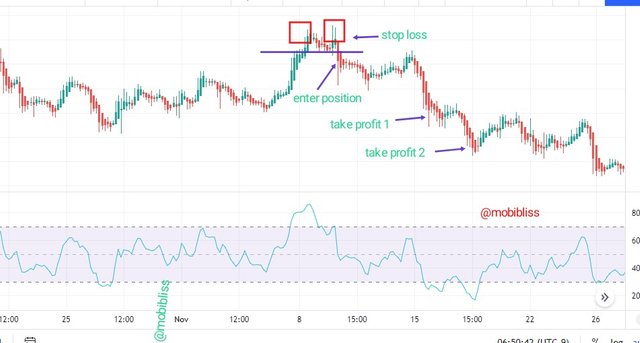
Double top and Double bottom
Double top or double bottom forms due to weakness of a dominant market pressure to continue.
Double top forms in an uptrend. The price chart forms a new higher high, then swings low and . breaks the support line indicating a reversal. But this time instead of continuing downwards, the price rise again to retest the previous high forming two peaks with a valley in the middle. Such formation indicates a reversal to the bearish.
The chart below shows double top formation and how to enter position.
Double bottom.
Double bottom forms in a bearish trend. The same weaknesses observed in the uptrend are noticed here but in opposite direction. The market made a new higher low, on its swing up it broke the resistance line. However, it did not continue upwards but reverse to retest previous lower high. This formation indicates a high probability of a bullish reversal.
See chart below of double bottom and how to enter a position.
place a demo trade using any crypto trading platform and enter a buy or sell position using any of the above mentioned trend reversal/continuation pattern.
Using a trend line to indicate reversal, I made a trade on iqoption demo account.
I began by drawing a trend line on a downtrend connecting the high points. I waited for the price to rise above the resistance line before entering a trade. I entered a position at the second candle.
Stop loss was placed below the resistance line.
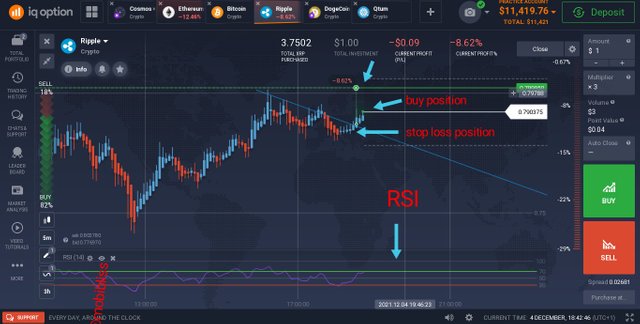
I was confident with the trade, therefore I used 1:3 risk to reward ratio. However 1:1 is recommended for beginners.
I monitored the trade to see it's profitability.
Let's see how we have done so far.
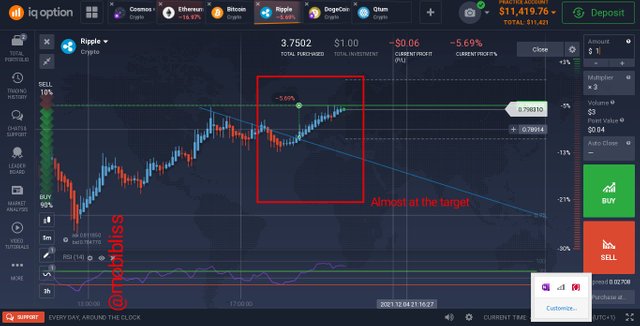
From the above image, we are just a pip away from the strike target.
CONCLUSION.
Trading Reversals are a good way to be profitable in the global market. Mastering the patterns thought in this week's class by professor @reminiscence01 can increase our chances.
It is important to be certain that a reversal is about before opening position. Combination be of chart patterns and some indicators can help fish out false signals .
Thank you.
image references
Tradingview.com
Iqoption demo template.
Tracing tools
Imarkup
Hello @mobibliss , I’m glad you participated in the 3rd week Season 5 of the Beginner’s class at the Steemit Crypto Academy.
Unfortunately, you do not qualify for #club5050 program which is a requirement to participate in the homework task.
Remark: Homework Task Disqualified
Downvoting a post can decrease pending rewards and make it less visible. Common reasons:
Submit
I make apology for the error, Please, revisit my post.
Thank you in anticipation.
@reminiscence01
Downvoting a post can decrease pending rewards and make it less visible. Common reasons:
Submit
This record changes, however, I have made Power-up
Downvoting a post can decrease pending rewards and make it less visible. Common reasons:
Submit
Please @reminiscence01, check my work, don't allow my effort to be in vain ...
Downvoting a post can decrease pending rewards and make it less visible. Common reasons:
Submit
Hello @mobibliss , I’m glad you participated in the 3rd week Season 5 of the Beginner’s class at the Steemit Crypto Academy. Your grades in this task are as follows:
Observations:
This is not a clear double top pattern.
Recommendation / Feedback:
Thank you for participating in this homework task.
Downvoting a post can decrease pending rewards and make it less visible. Common reasons:
Submit
Thank you
Downvoting a post can decrease pending rewards and make it less visible. Common reasons:
Submit