This article is my homework elaboration in Steemit Crypto Academy Season 6. Specifically, in the class of professor @nane15 regarding Basics to trade cryptocurrencies correctly Part. 2.

Question 1
Explain your understanding of charts, candlesticks, and time frames. (Use your own words and put screenshots)
CHART, CANDLESTICK, AND TIME FRAME
Charts, Candlesticks, and time frames are terms that are popular among traders or market activists because those terms are instruments that influence their investment decision-making. Hence, as a beginner who wants to apprehend a crypto world and take this class, I will explain the terms based on my understanding and research on this homework post.
One of the most basic spectrums in trading platforms is a chart. In light, the first thing we will see in the trading platform is a chart that moves up and down like a zigzag. This chart functions to represent the price movement of a stock or crypto pair on the exchange market. This price movement information is a crucial instrument for conducting technical analysis. The data is shown in sort periods, and we can specify the period in time frames settings. We can see price movements in seconds, minutes, days, months, or even years on the chart.
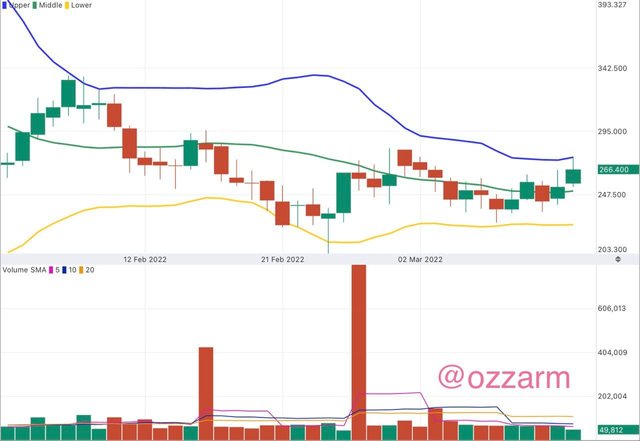
For the chart display, we can change it to a form that suits our style such as line charts, bar charts, and candlesticks. Study shows that candlesticks are the most popular chart type in presenting information on price movements of the crypto pairs or stocks in the market. So do I, by the way, I love to use a candlestick chart.
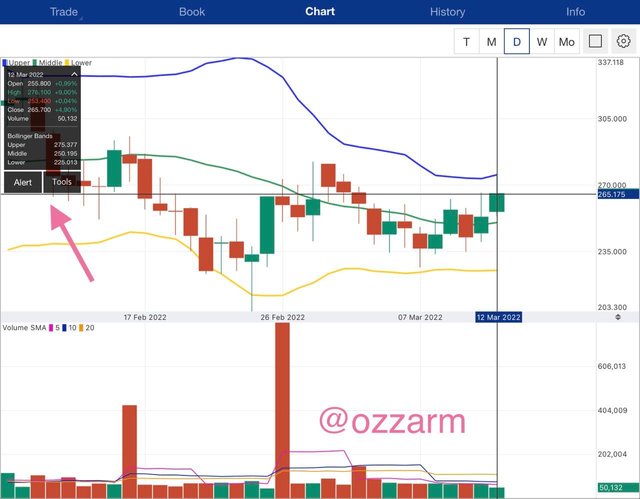
Each candle indicates the opening, highest, lowest, and closing prices. As a trading learner, a candlestick chart satisfied me to look at the price data at a certain time. Furthermore, the color of the candlestick also helps me in denoting who is dominating the market at the time. Is it the buyers or the sellers? When the buyers dominate the market, the color will be green. Meanwhile, the red candlestick signifies the sellers dominate the market.
It is also called the Japanese Candlestick Chart. Survey shows that the idea of the candlestick chart comes from a Japanese rice commodity trader in the 18th. He invented the trading laws, and his method evolved into the Japanese Candlestick Chart as what we know today.
As I mentioned earlier, we can select a range to view price history on the chart through time frames. Not only in second, but also in the various period, including months. For instance, I set D on the time frame, then the candlestick on the chart shows the price movement within one day. A new candlestick will appear the next day. As the picture below
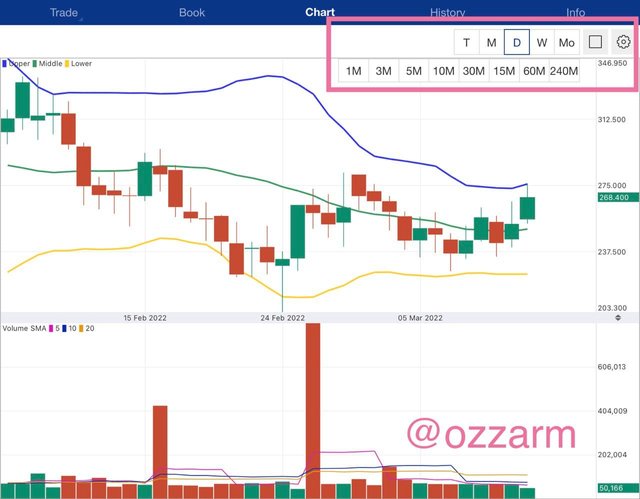
The same goes for other time settings. If I set 5M or 5 minutes on the time frame, the candlesticks on the chart depict price movements every five minutes. In short, once every five minutes, a new candlestick will be formed on the chart.
Indeed, the selection of the time frame will affect several things in trading activities. In trading, no one regulates the job description of the activists. Then, who manages the trading activities? It is the activists who drive all plans and decision-making from the trading time duration, trading frequency, and reward-risk probability estimation. Consequently, traders can choose how long they want to trade by setting the time frame. They can analyze price movements in the time span they like because that period is the best time they expect to do the business. The shorter the selected time frame, the faster the trading duration is and vice versa.
Moreover, the traders can manage how many times they want to enter and exit the market. Thus, the selection of time frames will affect their trading frequencies. If a trader prefers a short period, he will be too busy contributing to the stock market activity. However, if they pick a longer time, they can relax more and enjoy their days.
Furthermore, the time frame selection will also affect the potential reward risk. As the price chart fluctuates, sometimes the price can bounce up in a short time and fall in the next second. As a result, we must be careful when analyzing price action every time so that we can profit from trading activities.

Question 2
Explains how to identify support and resistance levels. (Give examples with at least 2 different graphs)
IDENTIFYING SUPPORT AND RESISTANCE LEVEL
The purpose of the Support and Resistance Level lines is to mark the location where the price is most likely to experience a significant movement. Will the current market continue or reverse and create a new market? The first thing to do in determining the Support and Resistance lines is to find the highest and lowest price points. Then, we draw a line on these points to form a horizontal line.
Meanwhile, Resistance is the highest price point in a time range. Trades can draw Resistance lines at the highest prices on the trending market to assist them in making trading decisions. It is because the signal of a market can be identified through price movements. We will catch a bullish trend signal in case there is a breakout where the price action breaks the resistance line. Later, the resistance line will turn into a support line.
On a simple note, price movements will usually move like a zigzag line between the Support and Resistance lines until buyers or sellers determine who is the strongest in the market at that time.
In my opinion, the easiest way to find Support and Resistance Level is looking for the Swing High and Swing Low. As the image follows:
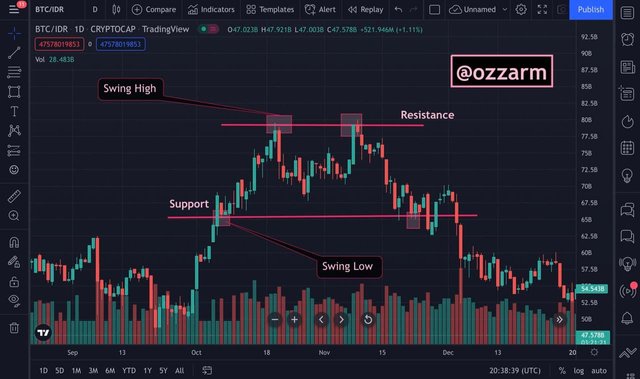
In addition, various separate techniques make it easier for traders to find these price points. For the most effective strategy in determining Support and Resistance lines, it all depends on personal preference. Nevertheless, this homework article will elaborate on some helpful tools in identifying Support and Resistance Level. These tools are:
- Fibonacci Retracement
- Round Numbers
- High Volume, Accumulation, and Distribution Zones

Question 3
Identifies and flags Fibonacci retracements, round numbers, high volume, and accumulation and distribution zones. (Each one in a different graph.)
FIBONACCI RETRACEMENT
First of all, Fibonacci Retracement is an advanced trading tool for technical analysis in the stock market. Basically, Fibonacci retracement uses ancient mathematics that is still very relevant today. This tool is used to make it easier for traders to determine Support and Resistance lines so that traders can determine the right time to enter the market and gain profit from their activities.
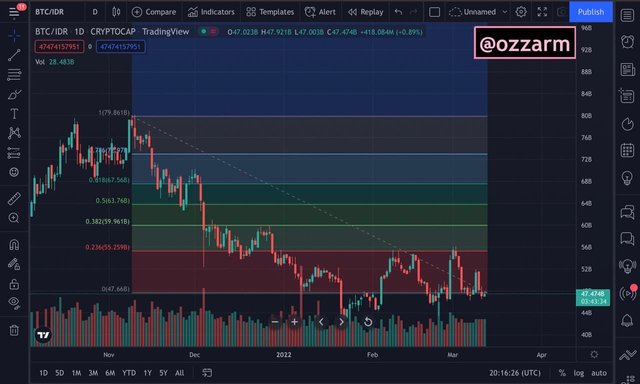
In the Trading View platform, we can find the Fibonacci Retracement tool in the third icon section on the right. Then select Fib. retracement. Then, we can click on the Lower High price of the first stage and drag it to the last point. That way, we will see the levels that exist in the Fibonacci Retracement. We can make these lines as Support and Resistance levels.
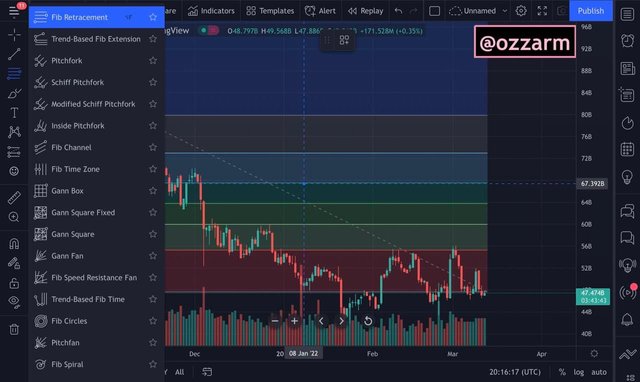
This is an example from a bearish trend:
This is an example from bullish trend:
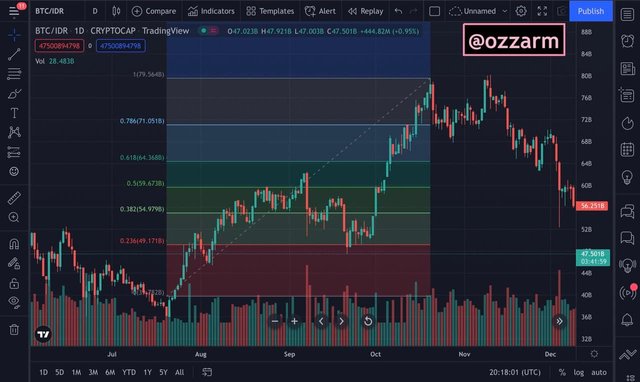
The Fibonacci sequence is a series of numbers. This number series is created because it has a repeating pattern. This repeating pattern on the Fibonacci sequence is unique. It is called golden ratio or phi. The golden ratio indicates the numbers of 1.618 and 0.618. The former number points that each number in Fibonacci is always worth 1.618 greater than the previous number. Whereas, the latter number signifies that it values 0.618 smaller than the number after it.
At the same time, financial science also has a golden ratio because it has a repeating pattern in the price of an asset, although it is not exactly the same as the Fibonacci sequence in ancient mathematics. The series of numbers on trading financial instruments are 0.236, 0.382, 0.618, 1.618, 2.618, …. If the figures are converted into a percentage, it will be 23.6%, 38.2%, ….
Therefore, traders can estimate the next price movement from the comparison of this sequence. For example, an item is worth $10. Then, the value of this item went up to $20. With the assistance of the sequence, a trader uses the 23.6% level in analyzing the next price. So, the calculation will be like this:
| Next price = Highest price – [Highest price – Lowest price (Fibonacci)] |
|---|
As a result:
X = $20 – [$20 - $10 (23.6%)]
X = $20 – [$10 (23.6%)]
X = $20 – $2.36
X = $17.64
ROUND NUMBERS
I am sure most of us prefer round numbers because they are manageable to calculate and convenient to look at. Here, we learned that we can define the Support and Resistance lines by looking at the round numbers on the candlesticks.
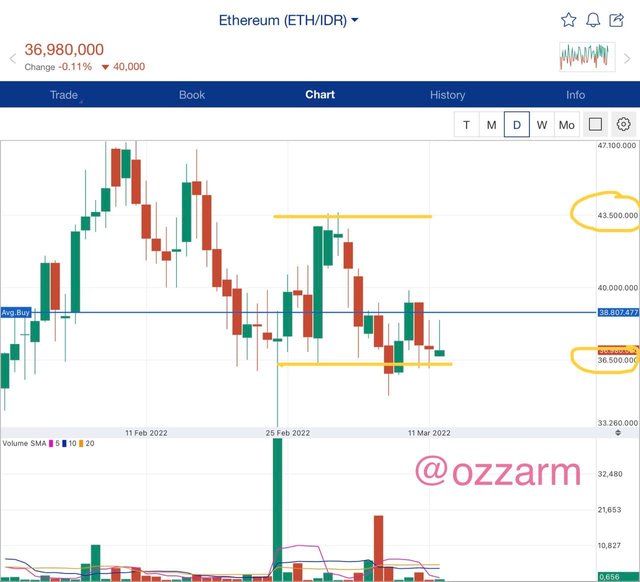
As shown in the picture, the crypto market that I decided to explain is ETH/IDR. Currently, the market is in a bearish trend. Yet, we still can profit in the market and make a good analysis. First, I need to position the Resistance line at IDR 43,500,000 as it is the highest price in round numbers. For the Support line, I set the price at IDR 36,500,000. Even though it looks like the lowest price has actually been below that price, I chose the nearer round numbers to make the technical analysis easier.
HIGH VOLUME, ACCUMULATION, DISTRIBUTION ZONES
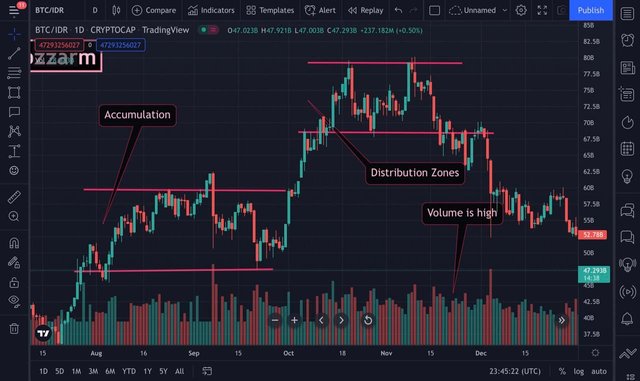
Every stock price in the stock market must experience rising, falling, and sideways. This market cycle even undergoes several repeated stages. Usually, the first sideways price is the first stage in the market. When the price breaks the resistance line, the price will go to the second stage, which is a distribution zone. The first stage is called accumulation.
The volume within the accumulation and distribution zones will relatively increase because the sentiment in the market is going up.

Question 4
It explains how to correctly identify a bounce and a breakout. (Screenshots required.)
IDENTIFYING BOUNCE AND BREAKOUT
In addition to identifying Support and Resistance levels, traders must also recognize the moment of price movement, namely Bounce and Breakout. After determining the Support and Resistance levels on the chart, we will pay attention to the price movement that shifts between the two lines. The crucial moment for traders is when the price approaches one of these lines as the direction of moving prices will be one of the considerations for traders to determine entry or exit points.
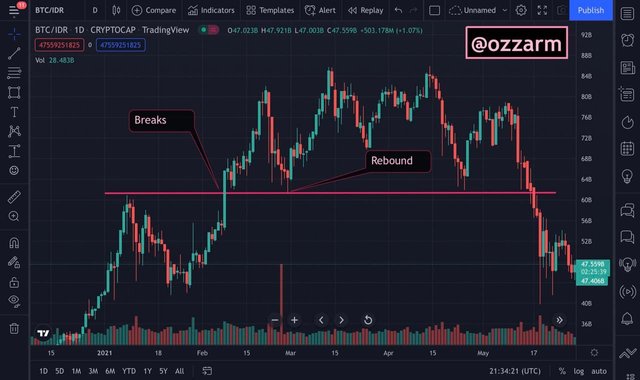
When traders find the price is bouncing and moving away after approaching one of the Support or Resistance lines, the moment is called Bounce or Rebound. Rebound price movements indicate that the current price trend is weak.
Rebound is different from Breakout. As mentioned before, the breakout moment is when the price crosses one of the Support or Resistance lines. This is because both lines function as a foothold for the stock or crypto pair price. If there is a breakout on the Support line, the stock or crypto pair will be in a bearish market. Meanwhile, if there is a breakout on the resistance line, there is a strong possibility that the stock will be in a bullish market.
Trading based on mere speculation tends to harm the activists. Systematic steps and quality technical analysis will be very profitable for traders. Therefore, traders should use the following steps to map the direction of price tendencies.
- Identify the Support and Resistance areas.
- Determine the points where the price most likely bounces or breaks the Support and Resistance lines.

Question 5
Explain that it is a false breakout. (Screenshots required.)
FALSE BREAKOUT
Although price bounces and breakouts are crucial moments for traders to determine the time of entry or exit, traders are not allowed to stick to price action completely. Frequently, the price movement on the chart shows a false signal. Sometimes the price fails to hold its strength in the market at that time. It causes the price that almost had breakouts, returns to the previous direction.
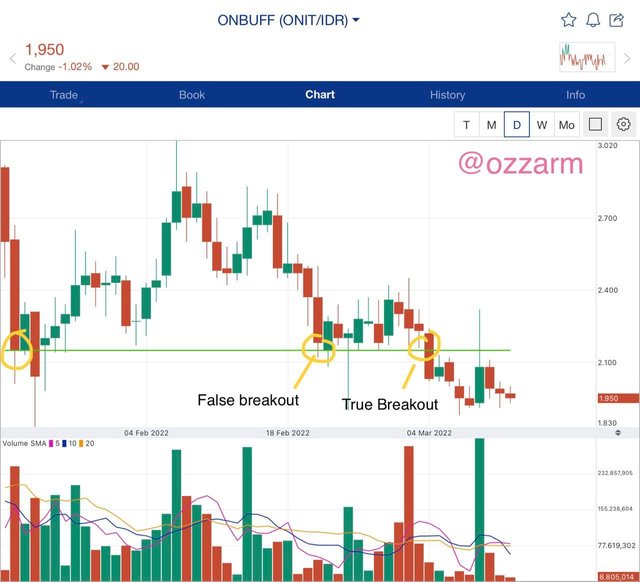
On the price chart above, in the ONIT/IDR market, we can see that a few days before February 24, 2022, the crypto price touched the Support line. However, on the following day, the price went up again. Overall in the next few days, the price went up slightly. However, the true breakouts happened after that. The price broke through the support line gradually and the crypto token was confirmed a bearish trend.
Survey shows that traders can look at the closing price from a daily time frame when the stock price enters the breakout phase. Traders can buy when the closing price is above the resistance level or sell when the price is below the support line.
The closing price is vital to avoid a false breakout because often it is a false breakout if the closing price fails to pass the key level.

Question 6
Explain your understanding of trend trading following the laws of supply and demand. It also explains how to place entry and exit orders following the laws of supply and demand. (Use at least one of the methods explained.)(Screenshots required.)
LAWS OF SUPPLY AND DEMAND
Basically, trading activity is buying and selling crypto tokens. It means that two parties (seller and buyer) have transactions to exchange the items. The basic understanding of profitable trading is that the selling price must be higher than the buying price. Same with crypto trading. However, the crypto price is not stable due to the high volatility of the stock market. Therefore, crypto traders must be good at taking opportunities when selling or buying positions.
To make it sound more professional, we call it supply and demand. Supply is the number of goods available at one time in the trading market, while demand is the number of goods desired at one time.
It is important to note that traders are not necessarily profitable when the supply is high whereas the demand is low. In light of when there is a high supply of goods but low demand, but the goods have not been sold. Hence, traders may experience losses when this happens.
Before analyzing the breakout and also the pullback. Preferably, we set the timeframe first. This timeframe should not be changed arbitrarily because the entry and exit timings are not valid. In fact, we can experience losses because we are just guessing the price.
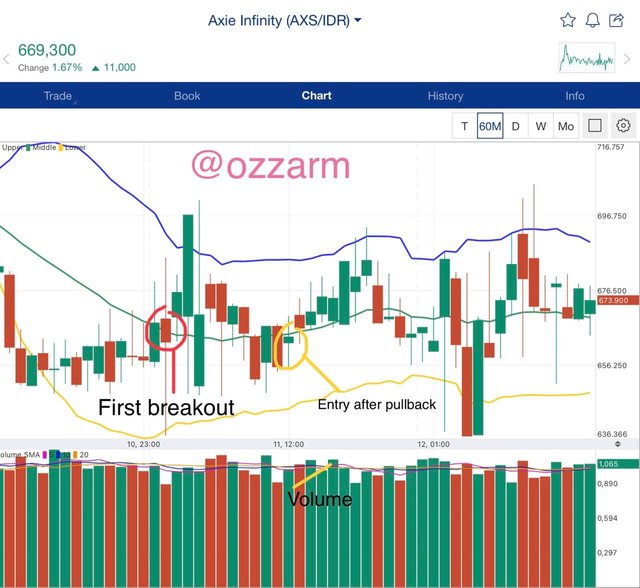
Then, we can see the price movement on the chart. Here I use Bollinger Bands instead of Support and Resistance levels. The highest band is my resistance limit while the lowest band is the support line. What will be my reference for determining breakouts is the middle band.
It would be better, I enter the market after the pullback and first breakout. I am waiting for the pullback to make me more confident with the trending price. As long as the price is still above the middle band, then that's when I can take profit. For the exit point, I set my stop-loss slightly higher than the price when I first entered the stock market.

Question 7
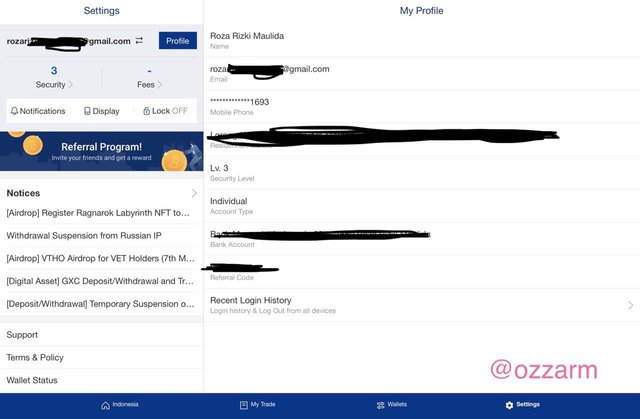
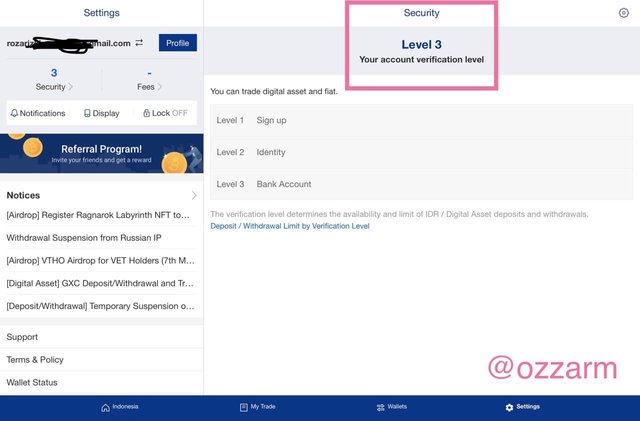
Open a real trade where you use at least one of the methods explained in the class. (Screenshots of the verified account are required.)
TRADE
As a novice trader who has less than a week of experience, I usually see the information of the book feature using laws of supply and demand. However, the profits are small if it is not accompanied by correct fundamental and technical analysis.
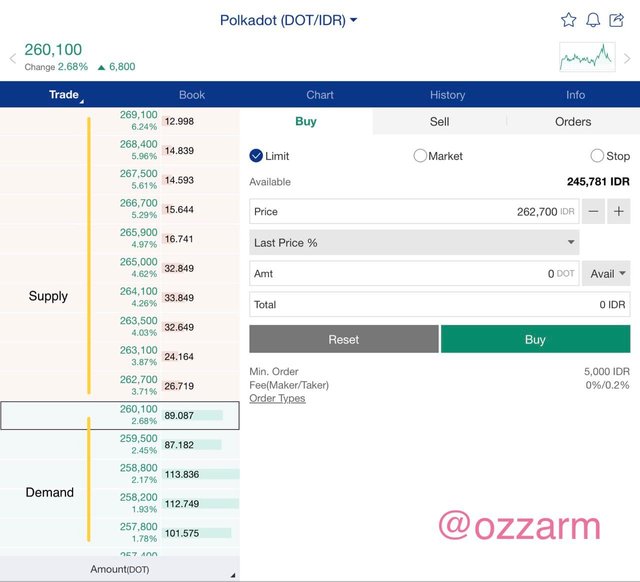
Judging from the picture above, we can conclude that the difference between the supply and demand prices is already profitable, even though it is small. Nonetheless, if we look at the price chart in a 60M or an hour timeframe, we can buy the crypto pair when the price is pulling back. In addition, the volume of green prices is rising.
To make it easier for me to determine support and resistance, I use the Bollinger Band. By using it, I simply found out the highest, lowest, and middle price.
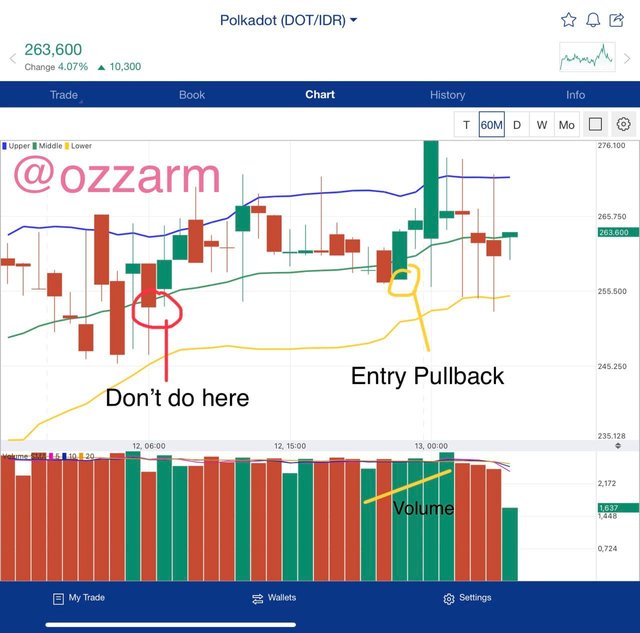
Now, I am learning to trade by laws of supply and demand with pullback entry where traders need to wait before entering a position. This is what I often do to ensure price movements.
By ensuring the price conditions, I have lower risk and opportunity to profit.
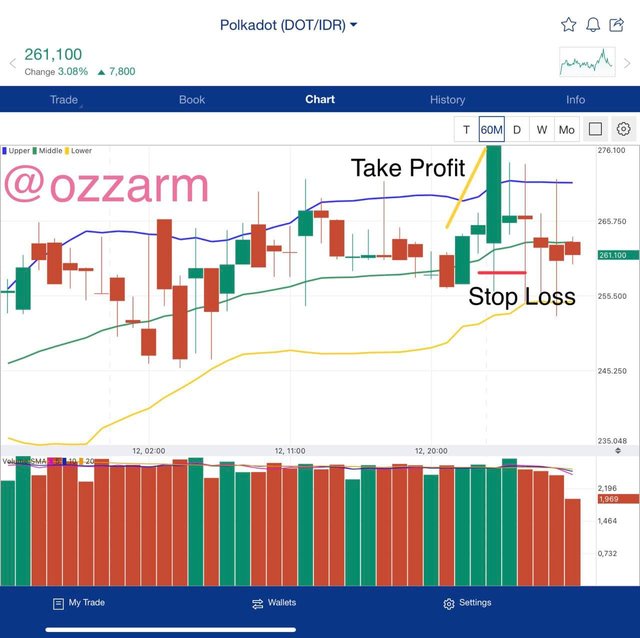
Again, I will look for the price volume on the chart to make sure time to profit and stop-loss. From the price volume, it can be seen that the volume slightly drop. Here, most of the time I will get anxious. However, I still set the stop-loss point a little above my purchasing price.
I use my trading account on Upbit Indonesia Exchange. I chose this platform because Upbit is one of the exchanges that has been legalized by BAPPEBTI (Indonesian Government Institution). Thus, trading on Upbit is secure for me.

Question 8
Conclusion
CONCLUSION
In this week, we learned about basic trading skills that covered some essential terms. They are charts, candlesticks, time frames, Support and Resistance Levels, bounces, breakouts, false breakouts, and many more. Charts and all the basic features are keys in trading on the stock market. Because, without price actions displayed on the chart, traders will not understand how a stock or crypto pair is growing in the market. With the price information, traders can decide the stock that will be profitable for investment and business matters. Correlated with the advanced features of the trading platform, traders can easily analyze price information at a certain time. This feature is a timeframe.
Moreover, we also learn two auxiliary lines that can help in making the best decision for entry and exit timing. These two lines are Support and Resistance lines. The most distinctive features of Support and Resistance levels are swing highs and lows. Swing High for the Resistance line limit while Swing Low for the Support line limit. In addition, another way to determine Support and Resistance lineas, we can also use Fibonacci Retracements, Round Numbers, and High Volume, Accumulation and Distribution Zones.
Furthermore, we also know the terms Bounce and Breakouts where these two moments will influence our final decision during trading activities. Even so, the breakouts moments sometimes can trick traders. It is due to when the price breaks through one of the lines, but then, the price strength weakens, and the price returns to the previous market. This situation is called a false break. Indeed, traders will lose if trapped by false signals like this. Therefore, it is suggested that traders ought to use confirmators to test their analysis and increase accuracy. Nonetheless, there are many trading methods that we learned in class. All of us are free to choose which trading method we feel is more comfortable to use.

Thank you to all professors who enlighten all the students in Steemit Crypto Academy through their guidance and knowledge. Your support always helps us present and future.
Signed.
@ozzarm