This article is my homework elaboration in Steemit Crypto Academy Season 6. Specifically, in the class of professor @shemul21 regarding Crypto Trading with Moving Average.

Question 1
Explain Your Understanding of Moving Average.
MOVING AVERAGE EXPLANATION
In modern times like today, there are variations types of work that can generate huge profits. One of them is trading. However, this job requires good skills in reading and analyzing market conditions or trends. Traders use trading tools to assist their work in analyzing asset price movements such as Moving Average.
Traders, either beginners or advanced, often use the Moving Average as their indicator in their trading strategy. It has a unique characteristic which is being able to filter out the irrelevant price fluctuations since this indicator calculates the average price of an asset in a certain period. The results of this filtered data will be visible in the form of a line. Moving Average method that uses a line graph based on market circumstances, this indicator is also referred to as a lagging indicator.
For the timeframe, traders can adjust the market history according to their needs. They can set the average price calculation in certain periods like 5, 20, 60, or 120. However, the movement of the Moving Average line can be slower compared to the price action of the crypto pair if the trader decides to use the longer period.
Regarding the average price of the crypto coin calculation, these weights are taken from the opening, closing, high, low, and median prices. By estimating the average price from market history, traders can notice the essential parts that can influence their final investment decision. It is because the results of the Moving Average indicator are used as a confirmation tool by traders after predicting market possibilities.
Moreover, the usage of Moving Average is also to identify the trend of stock value. Traders can identify the trending market with the help of the Moving Average line on the indicator chart. The Bearish Trend is noticeable when the price occupies the area below the Moving Average line. Meanwhile, the Bullish Trend is observable when the price tends to rise. It is where the price spots above the Moving Average line.
Traders can predict a reversal by looking at the pattern from the Moving Average Crossover that will be discussed later. Furthermore, Moving Average also helps traders to indicate the support and resistance levels by combining two Moving Average.
Indeed, high-quality analysis has a high probability of profit. As a result, traders can maximize their profit by credible predictions. In addition, trading confirmator tools such as the Moving Average increase the traders' confidence.

Question 2
What Are The Different Types of Moving Average? Differentiate Between Them.
There are three different types of Moving Average indicators. They are:
1. Simple Moving Average
2. Exponential Moving Average
3. Weighted Moving Average
Although there are three different types of moving averages, but the study shows that there are two types of moving averages that are a favorite for traders. Both are Simple Moving Average and Exponential Moving Average.
SIMPLE MOVING AVERAGE
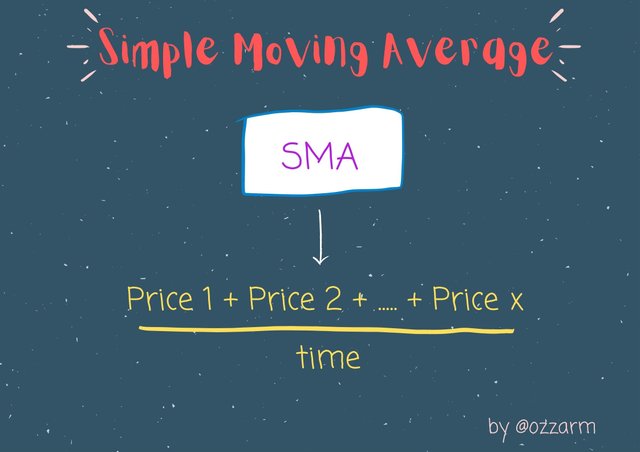
As the name, the Simple Moving Average (SMA) has the simplest calculation compared to other types of Moving Average. It is where all the most recent data points are summed and then divided by the number of data itself in a certain period.
As mentioned before, the MA indicator uses market history data from diverse prices to produce the average value of a crypto pair. Thus, traders used this indicator to find the best timing for entry and exit of the crypto market.
The price movement calculated from the Simple Moving Average is the average price movement. The price comes by adding up the current price then dividing it by the number of periods in the calculated average. Here is the formula of Simple Moving Average:
EXPONENTIAL MOVING AVERAGE
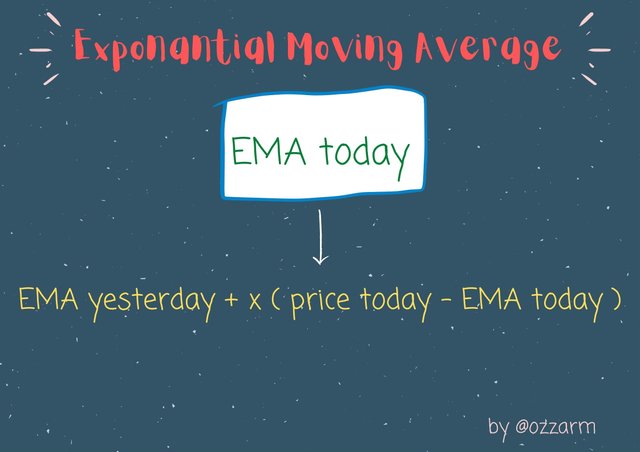
Similar to a Simple Moving Average, this type of moving average is also used to predict a new market in a particular period. However, it is different from SMA, EMA gives more weight to the movements that occur today than in the past. It is due to EMA is being calculated exponentially. That is, EMA is more sensitive to current market conditions than SMA.
As the EMA responds to current price changes well, traders can make decisions faster during trading activities. Whether the chart is an uptrend or downtrend, we can execute the entry point to buy at the point closest to the EMA.
Traders can utilize the delay in showing a trend on a short EMA if they want to do scalping. However, EMA sometimes gives a false signal. Thus, traders must be careful while examining the market.
To calculate the EMA, traders can use this formula:
.jpg)
WEIGHTED MOVING AVERAGE
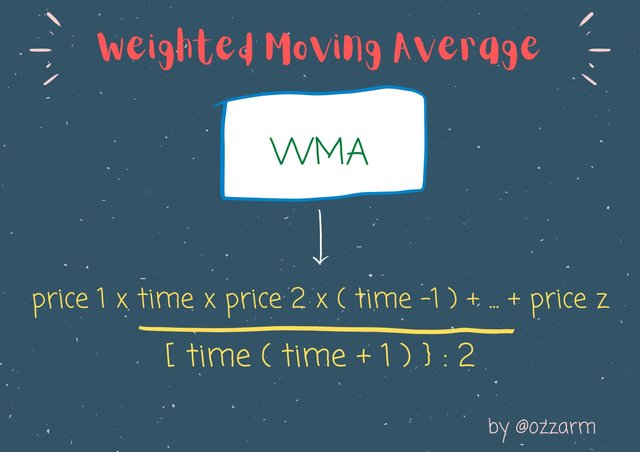
The Weighted Moving Average method is an advanced moving average indicator by adding the distributed weight in the calculation. The load distribution given to the data will affect its accuracy. Typically, the load of the distributed data is between 1-100% over the period. Later, it will be calculated based on the crypto token's price.
The weight on projected prices is heavier than the weight on historical prices. This series will notify traders of the total price amount in a period. It is said that the accuracy of the lines on the graph is high. Nonetheless, it is suggested that the traders should use other confirmators to testify their analysis. In short, WMA serves traders in figuring out the fluctuating average prices based on the distributed weight of the price.
.jpg)

Question 3
Identify Entry and Exit Points Using Moving Average. (Demonstrate with Screenshots)
In identifying entry and exit points using the Moving Average, we can look at the moving average line. After that, it is easy for us to determine the time to take profit and also stop-loss if we know the support and resistance levels.
Here, I take an example of the market in the SOL/BTC crypto pair market. First of all, the easiest thing to get into the market is when the moving average lines are in the same pattern, up or down. As the picture below:
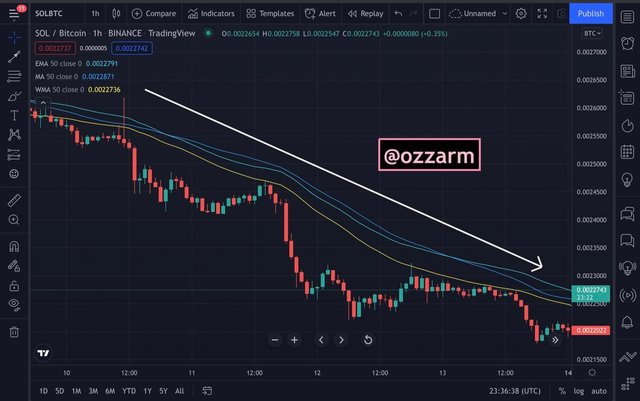
In the image above, I used three moving averages, the EMA, MA, and WMA. All of them are 50-days moving averages.
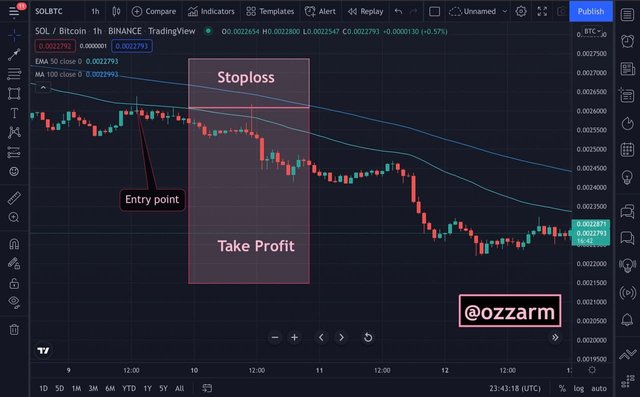
Then, I will determine the entry point, take profit, and stop-loss on the bearish trend using the EMA-50 and MA-50. Before that, I have to determine the resistance line first. The EMA-50 is the resistance level. Then, we can entry at the price that is closest to the EMA line. It is time to take profit as long as the price below the EMA line and stop loss if the price above the EMA-50.
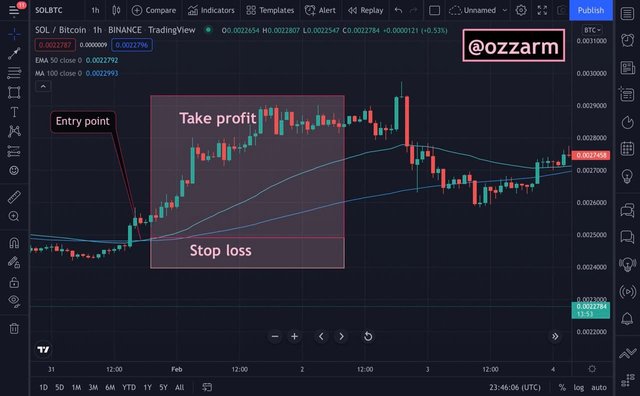
For the Bullish trend, the EMA line can be the support level. It is time for taking profit as the price above the line while it is time to stoploss when the price below the line.

Question 4
What do you understand by Crossover? Explain in Your Own Words.
MOVING AVERAGE CROSSOVER
Crossover Moving Average consists of double and triple crossover moving averages. It is a type of technical indicator for stock analysis as traders utilize more than one Moving Average. It refers to the point on the chart where there is a crossover between the indicator.
As I mentioned earlier, Moving Average Crossovers functions to assist traders to pinpoint trend patterns, including the direction of the price trend, where entry point can be executed, and if there is potential for the trending market to end or reverse.
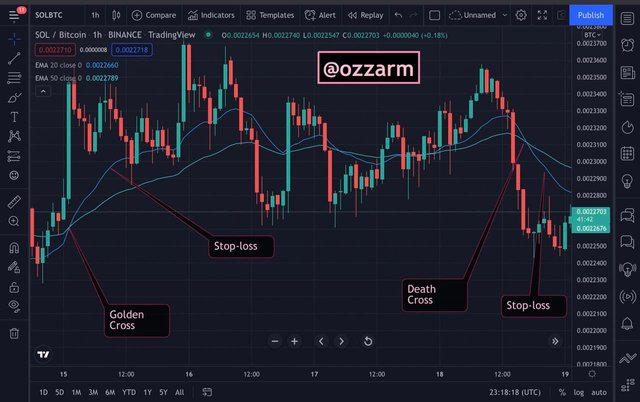
The Moving Average Crossover system has created two terms for the crossover moments, "Golden Cross" and "Death Cross". The former is where the short-term moving average crosses above the long-term moving average. Meanwhile, the latter is where the short-term moving average crosses below the long-term moving average.
Usually, a shorter and more reactive moving average is more accurate. Therefore, this kind of signal offers maximum profit. Trades can make an entry point there.
In addition, when we find the crosses line at the Moving Averages, we can start entering trades by setting our stop-loss above or below the cross.

Question 5
Explain The Limitations of Moving Average.
LIMITATION OF MOVING AVERAGE
As I have learned from the beginning following the Steemit Crypto Academy, no indicator is 100% accurate because market movements are too dynamic. Therefore, no matter how good an indicator is, it must have limitations. Same thing with Moving Average. Here I will list some disadvantages of the Moving Average:
- We cannot trade when the price is far from the Moving Average: We can only enter the market when the price is close to and rebounds on the moving average. That is our support or resistance. Not all supply and demand charts can be entered. Only the base on the moving average is eligible for entry.
The moving average method is not accurate enough to reflect the latest data trends.
It requires a lot of data in the past. Thus, traders who trade in long periods, such as weekly or monthly will get more benefits than intra-day traders.
It is slow-witted to data changes that often occur in the market.

Question 6
Conclusion
CONCLUSION
In conclusion, there is an indicator called Moving Average. It provides the average price of a crypto token in the market which has been filtrated any irrelevant data. The result of the data is displayed in a line chart form. Since the information in the Moving Average (MA) is plotted on a graph that makes it easier for traders to read the trending market, thus, the line on this indicator can help traders determine the support and resistance level, entry or exit timings.
Moreover, the Moving Average indicator is categorized into three types, Simple Moving Average, Exponential Moving Average, and Weighted Moving Average. All are great indicators, depending on how the traders operate them. In short, traders ought to adjust their needs to their trading strategy. So, they can optimize the usage of the indicator as each MA type has its characteristic and formula to calculate the intended data.
In general, moving averages are good indicators for technical analysis, but still, there are some aspects of moving averages that traders need to consider. As we discussed above, moving averages are calculated based on historical data. It denotes the estimation only concludes the trend based on price information in the past. Correspondingly, traders must consider other factors that can affect stock performance in the future as new competitors, demand and supply of crypto pairs, and other fundamental analyses. Following this, investors and traders need to recognize that Moving Average is not the only indicator that can be used for technical analysis. Hence, it is suggested that traders have to measure their investment goals carefully and make a good trading strategy that suits them best.

Thank you to all professors who enlighten all the students in Steemit Crypto Academy through their guidance and knowledge. Your support always helps us present and future.
Signed.
@ozzarm