HOMEWORK:
1.- In your own words, what is fundamental analysis? Do you think it is important for a trader? Justify the answer.
2.- Explain what you understand by technical analysis and show the differences with fundamental analysis.
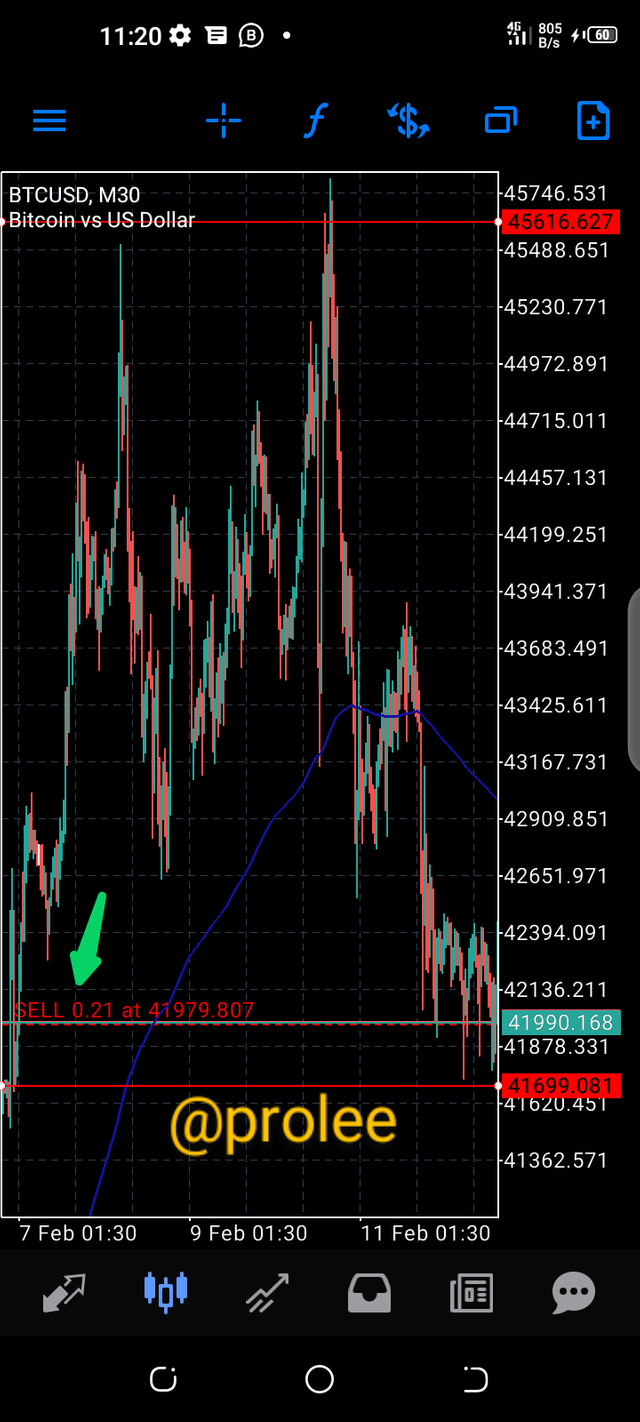
3.- In a demo account, execute a sell order in the cryptocurrency market, placing the support and resistance lines in time frames of 1 hour and 30 minutes. Screenshots are required.
4.- In a demo account, execute a buy order in the cryptocurrency market, placing the support and resistance lines in time frames of 1 day and 4 hours.
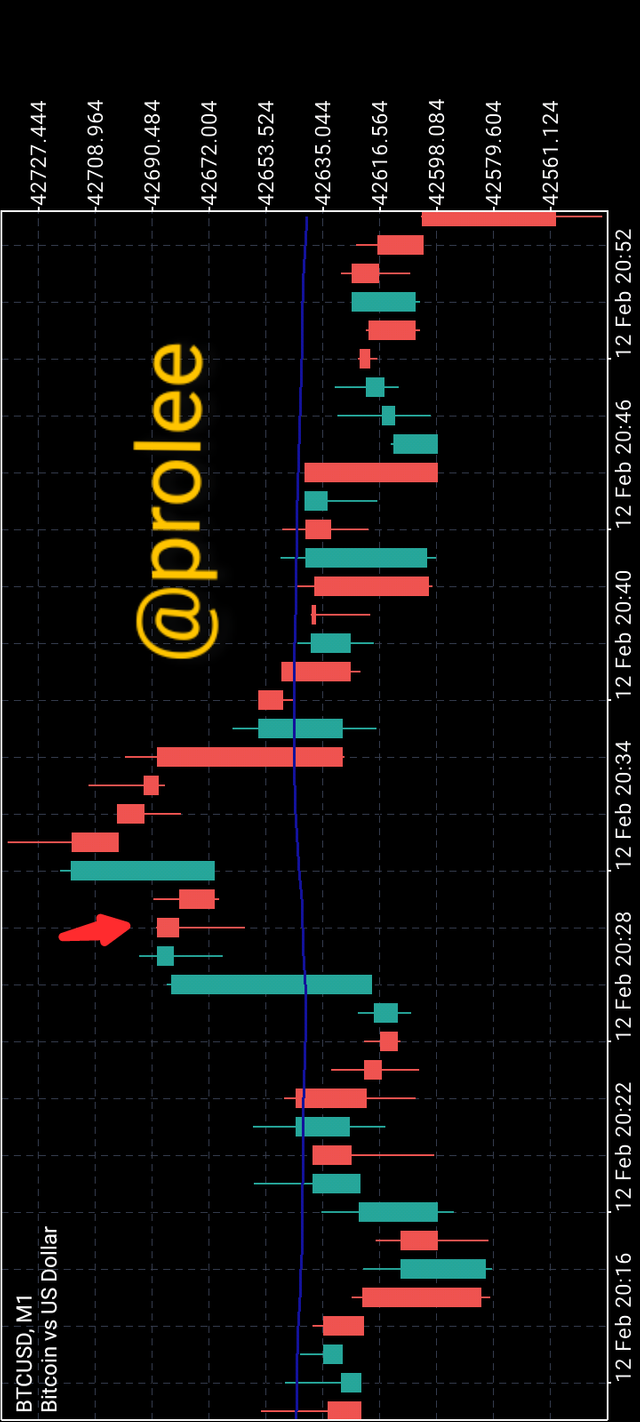
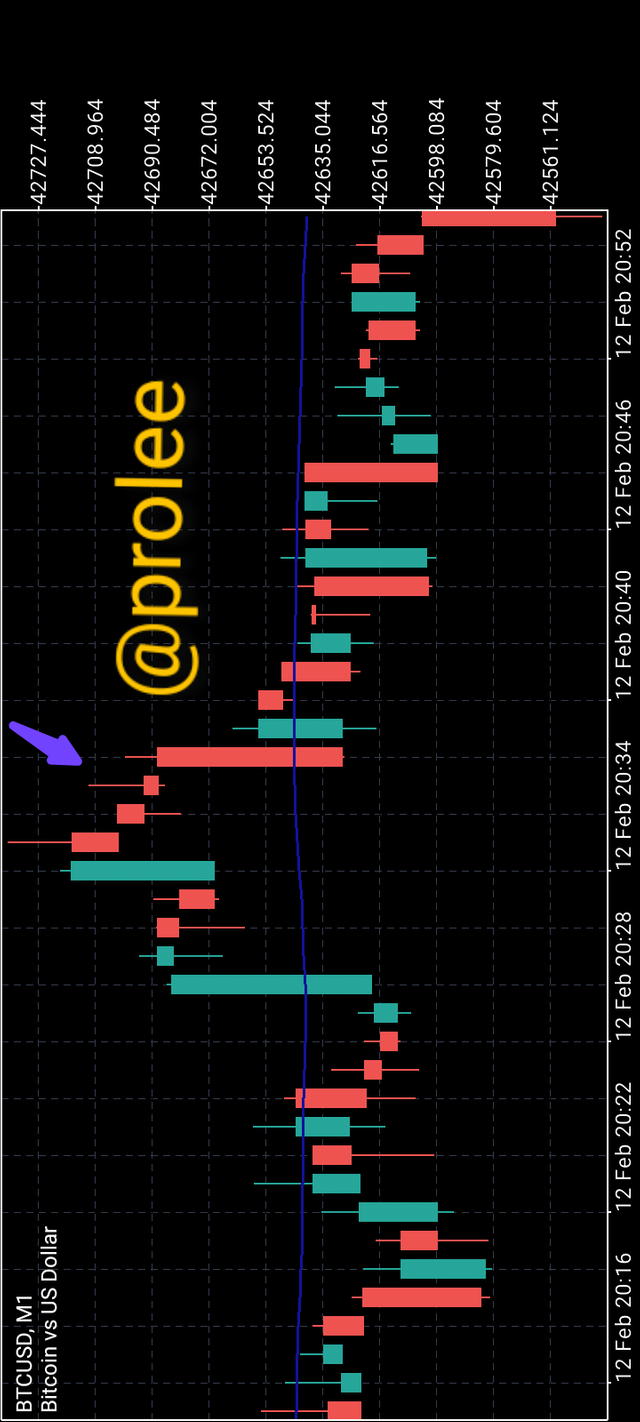
5.- Explain the “Hanging Man” and “Shooting Star” candlestick patterns. Show both candlestick patterns on a cryptocurrency market chart. Screenshot is required.
6.- Conclusion.
1.- In your own words, what is fundamental analysis? Do you think it is important for a trader? Justify the answer.
Fundamental Analysis
Fundamental analysis is simply an important way of researching or analyzing the fluctuation of the price of a currency through the country's economic, political and social activities.
It's a no difficult challenge for those persons who follow up the economic, political, e.t.c news of a country all the time.
In a breakdown, Fundamental analysis affects the trading market so well. If a country is having a poor economic system, it's certain that the price of their currency will fall. I clearly remembered when the Coronavirus Pandemic came up, it so well affected the price of many country's currency because business activities were reducing in the country, since everyone was experiencing lockdown. As a forex trader and investor when looking at that kind of incident where the currency exchange is low, no one will buy or invest in such currency. But assuming the currency exchange system is good which will lead to higher demand of the currency-denominated assets, it'll be concluded that there would be a good price value which will serve as a welcome address for traders to purchase such pair.
In summary, Fundamental analysis is a pattern of evaluating the essential value of a currency and studying the economic, political and social factors which stand to influence or sway the price of that currency in the future
ii) For sure it's important to a trader especially forex traders since we've already discussed before now that fundamental analysis deals on research about the price movement of a currency by taking consciousness of the political, economic and social news of that country, then it's crystal clear when a trader does this, he's in a better position to know when to buy or sell a particular currency. VERY SIMPLE.
2.- Explain what you understand by technical analysis and show the differences with fundamental analysis.
Technical Analysis
Unlike the Fundamental analysis, those traders who base on Technical analysis believe most of the fundamental events, news or data are already in price and charts, so they trade based on the price and not depending on any country's economical, political. etc news. Am not exempted from this type of analysis, that's what I use most times in my Crypto trading.
In the Technical analysis the trends or movement of price are are been studied then we wait for repetition of a particular trend or pattern so we can predict the next price movement, whether bullish or bearish since trends do repeat most of the time.
So it's clear that technical analysts uses price analysis to determine the market direction. A major help in using this type of analysis is the SUPPORT AND RESISTANCE. Let's look at a little explanation of this terms..
SUPPORT AND RESISTANCE
What is Support and Resistance?
“Support and resistance” is one of the most widely used concepts in trading.
Strangely enough, everyone seems to have their own idea of how you should measure support and resistance.
When the price moves up and then pulls back, the highest point reached before it pulled back is RESISTANCE. Resistance levels indicate where there will be a surplus of sellers.
When the price continues up again, the lowest point reached before it started back is now SUPPORT. Support levels indicate where there will be a surplus of buyers.
In this way, resistance and support are continually formed as the price moves up and down over time.
The reverse is true during a downtrend.
In the most basic way, this is how support and resistance are normally traded:
Trade the “Bounce”
Buy when the price falls towards support.
Sell when the price rises towards resistance.
Trade the “Break”
Buy when the price breaks up through resistance.
Sell when the price breaks down through support.
A “bounce” and “break”? Say what? If you’re a little bit confused, no need to worry as we will cover these concepts in more detail later.
One way to help you find these zones is to plot support and resistance on a line chart rather than a candlestick chart.
The reason is that line charts only show you the closing price while candlesticks add extreme highs and lows to the picture.
3.- In a demo account, execute a sell order in the cryptocurrency market, placing the support and resistance lines in time frames of 1 hour and 30 minutes. Screenshots are required.

5.- Explain the “Hanging Man” and “Shooting Star” candlestick patterns. Show both candlestick patterns on a cryptocurrency market chart. Screenshot is required.
Hanging man
This kind of candle stick is found in an uptrend off price chart. It is a bearish reversal candlestick. It has a wick that is as long as double it's main body, which appears to be short. The body of the candlestick is always at the Upper end of the candlestick and the shadow below. It shows the sellers wants to take over the market.

Hanging man
Shooting Star
This candle forms when buyers push the market higher after the open but they get rejected by sellers so the market closes lower than the highest price. We call this "Wick Rejections".
This kind of candlestick look exactly as an inverted hammer but it's found after an uptrending, signifying a reversal in uptrend. Also showing that buyers are getting weak and the sellers are about taking over the market. It has a long shadow and a short main body. It's body is positioned low and it's shadow is at the top end.

Shooting Star
Criteria:
Must occur at the top of an uptrend or resistance level.