Hello Steemians!
It's another week of Steemit Engagement Challenge and I love to participate in Crypto Academy contests and Volatility is a topic for this week and let's discuss about this topic.

In your own words, how does volatility affect cryptocurrencies? Is it beneficial or detrimental.
Volitality can be considered as quick and sudden changes in the price of Cryptocurrencies. Crypto currency Market is considered as one of the most volatile market because We can experience unexpected pump and dump in the price of cryptocurrencies.
In simple words, Volatility can be defined as how quick the price of an asset moves. Price of crypto asset can move up and down unexpectedly like anytime.
Like If we compare Cryptocurrency market with Stock market, then Stock market is not so volatile which means Price of stock market does not move a lot suddenly.
We experience many Cryptocurrencies which generally goes upto 2x, 3x in no time and some cryptocurrencies goes down to half in no time and this defines the volitality of crypto market.
Volitality is high in Cryptocurrency which means We can make money very fast and We can also lose money as fast as we make and this is because high volitality and there is many quick sudden movements in price of crypto assets.
 |  |
|---|
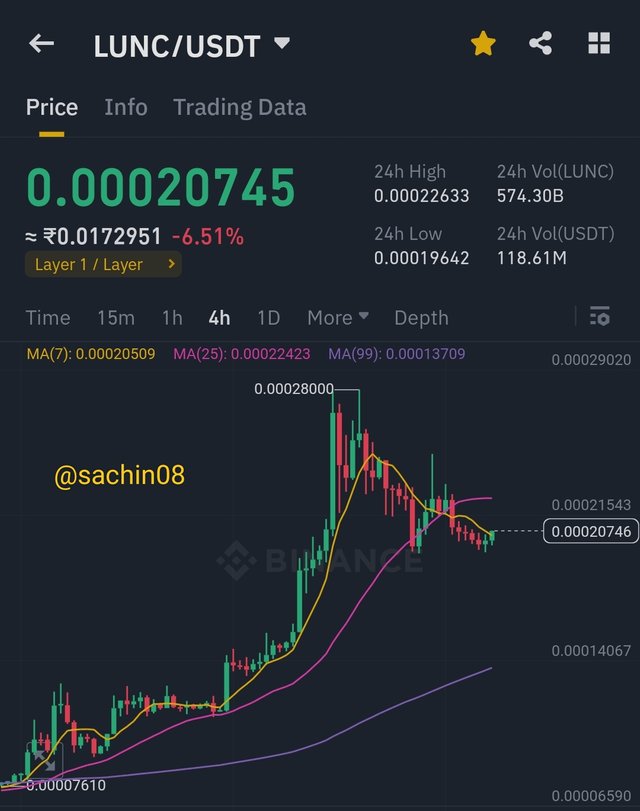
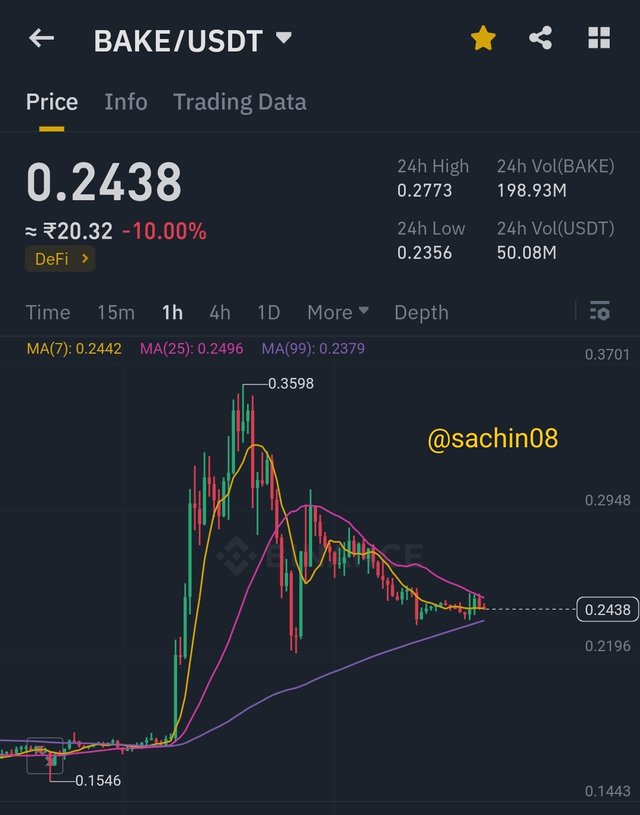
As you can see in the above images, I have provided charts of LUNC/USDT and BAKE/USDT and the price of LUNC has moved around 4x in less than 2 weeks and the price of BAKE has moved around 2x in less than 2 days and this describes the volitality of cryptocurrency market.
Now, Let's discuss about the benefits or disadvantages of volitality. Well According to me, It generally depends on a trader as Traders always know that there is high volitality in this market and They should always be ready for any circumstances.
There are many factors depend on it like we can make this volitality beneficial like if we properly do technical analysis and take proper entry in the market, then we can make profit of this high volatile situation.
Well, Everything is not in control of a trader and Trader can incur loss also if Market moves suddenly against the direction of trader and this can result in loss of trader.

Name and describe a technical indicator that measures the market volatility of an asset.
There are many technical indicators present which can help traders in measuring the market volitality like ATR Indicator, Bollinger Bands, VIX and many more.
I will discuss about Bollinger Bands as I also use this indicator in my technical analysis and I found this very useful. It is a technical indicator which help traders in measuring the volitality of the market.
It has three lines and middle one is known as Moving average which a trader can also customize. And other two lines are positioned on either side of the moving average line. Line above MA is Upper Band and the line below MA is known as lower band.
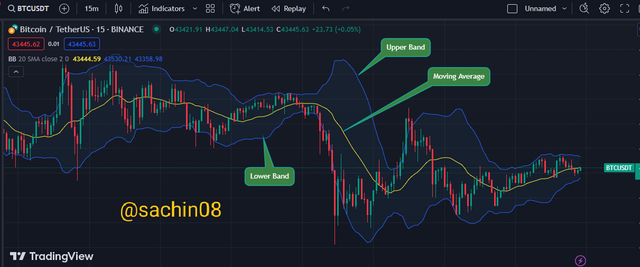
We can identify whether there is high volitality or low volitality in the market with the help of Bollinger Bands. We can also identify various patterns like Double Top and Double bottom with the help of this indicator.
It can help a trader in taking entry in trades with the help of upper and lower bands but It is suggested to not take entry when the bands are expanding as It denotes high volatility in the market.

Describe the step-by-step to be able to include this indicator in the STEEM/USDT chart. You can use the Tradingview platform. Show screenshots.
Now, I will discuss about how to add Bollinger Bands in the chart of STEEMUSDT. I will use Trading view platform. So, First of all, We have to go to the TradingView Platform.
- First, Select STEEM/USDT pair in the symbol option and then, the chart of STEEM will appear.
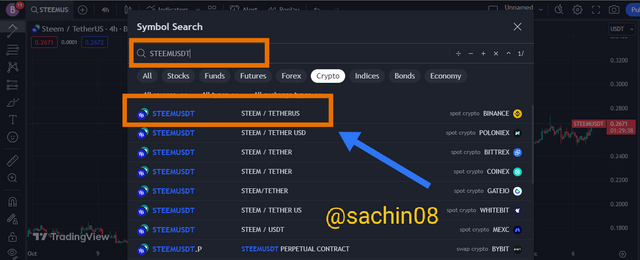
- Then, You will see an option of Indicators in the top left corner of the page. So, Click on the Indicator tab.
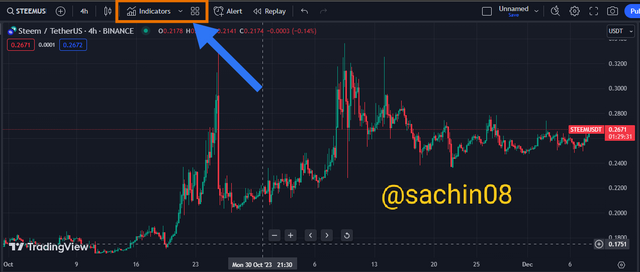
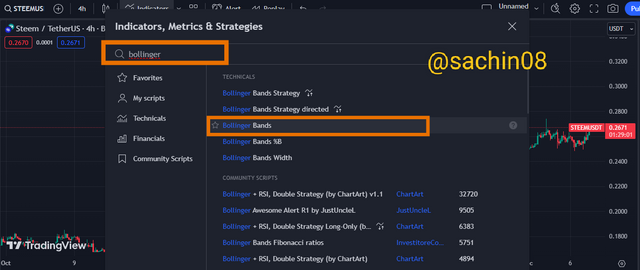
- After that, You will see a search bar menu and then, Click on the Search Bar and type Bollinger on the Search bar and then, Click on the Bollinger Bands option from the list.
- After clicking on the Bollinger bands option, This Indicator will appear on the chart of STEEM/USDT and then You can analyse the chart using that indicator.
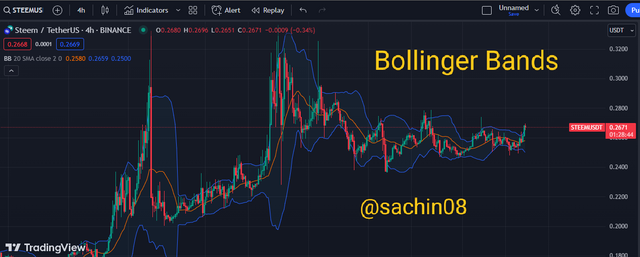
Through these steps, We can successfully add this indicator in the chart of STEEM/USDT and We can also add more indicators on this chart by following the same above steps which I have mentioned.

Explain in your own words, what happened to the volatility in the last month of the STEEM/USDT chart.
We all know that Crypto Market is highly volatile and We have also seen volatility in the STEEM/USDT chart last month. Steem was highly volatile at sometime last month and let me discuss it with you.
During last month, When Steem was listed in Future trading of MEXC and Binance, then It experienced a high volatility in it's price.
We have seen a sudden pump in the price of STEEM in the month of November like It was pumped from 0.2$ to 0.34$ and It was a high volatility in it's price at that time.
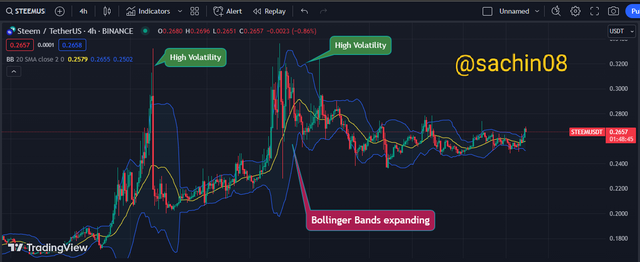
You can see from the above image, I have mentioned high volatility points in the chart of STEEM/USDT and We can also see that Bands of Bollinger Indicator are expanding which is a sign of high volatility.
During that volatility in the price of Steem, Many traders who are holding it or bought it at 0.2$ zone would have made decent profit from that volatility. And after touching 0.34$ zone, It's price also went to 0.24$ zone which shows the high volatility of the market.

Do you think the future of cryptocurrencies is more stable? Give your own opinion.
It is hard to predict the future of Cryptocurrencies but I believe that the future of Cryptocurrencies is stable as Many countries have started adopting it and Governments of some countries are regulating cryptocurrencies.
People all around the world are learning about cryptocurrencies and investing in it and Because of it's many benefits like transparency, faster and cheaper transactions, People are choosing this method to transfer currencies.
And We have seen many pump and dump in the market of Cryptocurrencies, Many assets become dead whereas Many currencies are strong in which people are investing.
I strongly believe that people have trust in cryptocurrencies and Number of people investing im cryptocurrencies is also increasing time by time which is also a sign of goof future of cryptocurrencies.

Conclusion
I have discussed about Volatility in cryptocurrencies in this post and Crypto Market is highly volatile. I have also discussed about technical indicators which can help us to measure the volatility in the market.
It was really an amazing topic for this week and I am glad to participate in this contest.
I would like to invite @steemdoctor1, @casv and @sahar78 to participate in this contest.
Thank You.
@sachin08
It is a common thing in crypto-currency that it fluctuates in every sense, sometimes up, sometimes down. gives and many people follow the crypto currency signals by their own account by making more profit than what it is and there is a special type of signal in crypto currency when it goes up people sell things but when they go down It means that the red line is that whenever they have a show, they buy things, the sale and brother's system continues. Got it and always keep commenting on other friends' posts.
Downvoting a post can decrease pending rewards and make it less visible. Common reasons:
Submit
True, It is common thing that price fluctuates but In cryptocurrency market, Volatility is high than other markets.
Thanks for going through my post.
Downvoting a post can decrease pending rewards and make it less visible. Common reasons:
Submit
Upvoted. Thank You for sending some of your rewards to @null. It will make Steem stronger.
Downvoting a post can decrease pending rewards and make it less visible. Common reasons:
Submit
Saludos cordiales estimado sachin08.
La volatilidad nos presenta beneficios y riesgos, muchos traders se benefician con este juego de las criptomonedas llamado volatilidad, ese rango de variación de precios mantiene el mercado activo, las bandas de bollinger son una excelente herramienta para medir, cuantificar y poder entender el mecanismo de la volatilidad.
Excelentes palabras para explicarnos cada una de las preguntas planteadas.
Éxitos y bendiciones.
Downvoting a post can decrease pending rewards and make it less visible. Common reasons:
Submit
Yes, Many traders can take advantage of high volatility in the market and can generate profit from this situation.
Thanks for going through my post brother.
Downvoting a post can decrease pending rewards and make it less visible. Common reasons:
Submit
@sachin08 Your explanation of cryptocurrency volatility is clear making it easy for both beginners and experienced traders to understand. The real-world examples and charts add a practical touch to your insights. Your choice of Bollinger Bands as a technical indicator is excellent and the step-by-step guide on how to include it in the STEEM/USDT chart using TradingView is incredibly helpful.
The analysis of STEEM's volatility in the last month especially during its listing in future trading on MEXC and Binance provides valuable context. The visuals and annotations in your charts make it easy to follow the changes in volatility over time.
Your perspective on the benefits and risks of volatility shows a balanced understanding of the crypto market. I appreciate your optimism about the future of cryptocurrencies emphasizing their growing adoption and the trust people place in them. Best of luck in the contest!
Downvoting a post can decrease pending rewards and make it less visible. Common reasons:
Submit
Yes, Bollinger bands is indeed a great indicator. Thanks for reading my post.
Downvoting a post can decrease pending rewards and make it less visible. Common reasons:
Submit
You have discussed well about volatility and the best indicator for checking volatility in the market which I find so useful.
Downvoting a post can decrease pending rewards and make it less visible. Common reasons:
Submit
Thanks for going through my post.
Downvoting a post can decrease pending rewards and make it less visible. Common reasons:
Submit
Hey there, my friend!
I just wanted to say that your explanations are absolutely on point. You did an amazing job breaking down the concept of volatility in such a simple and understandable way. It's clear that you have a great understanding of the subject.
When it comes to technical analysis, I also find the Bollinger Bands Indicator to be a solid tool. It really helps analyze different crypto assets and to help traders make informed decisions.
I must say, your post was truly fantastic! You've put in a lot of effort and it shows. I wish you the best of luck! 👍
Downvoting a post can decrease pending rewards and make it less visible. Common reasons:
Submit
Yes, Bollinger Bands is a good technical indicator which helps in technical analysis. Thanks for going through my post brother.
Downvoting a post can decrease pending rewards and make it less visible. Common reasons:
Submit
greeting @sachin08 Great engagement with the Steemit community! Your explanation of volatility in the cryptocurrency market is clear and concise. The use of real-time charts, such as LUNC/USDT and BAKE/USDT, effectively illustrates the rapid and substantial price movements, emphasizing the inherent volatility in the crypto space.
Your discussion on the benefits and disadvantages of volatility is insightful, highlighting the opportunities for profit through strategic trading and the risks associated with sudden market movements. It's evident that you understand the dynamics of the crypto market and the importance of being prepared for unexpected fluctuations.
The introduction of the Bollinger Bands as a technical indicator for measuring market volatility adds depth to your response. It's excellent that you're sharing practical insights into the tools you use in your technical analysis, making your contribution valuable to fellow Steemians.
Keep up the great work, and best of luck in the Steemit Engagement Challenge✨
Downvoting a post can decrease pending rewards and make it less visible. Common reasons:
Submit
Thanks for going through my post.
Bollinger bands is truly a great indicator if we want to find out the volatility in the current market.
Downvoting a post can decrease pending rewards and make it less visible. Common reasons:
Submit
Definiste claramente el concepto de la volatilidad y el aprovechamiento de esa circunstancia por los traders para generar grandes ganancias en poco tiempo o grandes pérdidas sino las cosas no salen como lo esperado.
El uso de las Bandas de Bollinger para medir la volatilidad es excelente, además nos permite ver la tendencia y el comportamiento futuro en corto.
Saludos y éxitos en tu post.
Downvoting a post can decrease pending rewards and make it less visible. Common reasons:
Submit
Thanks for reading my post
Downvoting a post can decrease pending rewards and make it less visible. Common reasons:
Submit
Thanks for your participation in this engagement challenge and for sharing your valuable insights or knowledge about dis particular topic and I can understand that you have good knowledge about this topic because you have explain all questions in deep way
You have explained in one of the most easiest way about basics of volatility as well as you tried your best to explain in different steps about bullingers band and secondly if I talk about future of cryptocurrency then we all know that as it is very volatile in its nature so due to this reason we cannot accurately predict about it but still there are some predictions which are saying that currency is going to be more stable as one as in the above question you have also explain and according to the screenshot in last 30 days decreasing we can see
I wish good luck to you in your participation. I wish to see more good content from you in future
Downvoting a post can decrease pending rewards and make it less visible. Common reasons:
Submit
I am glad to read this from your side. Thanks for going through my post
Downvoting a post can decrease pending rewards and make it less visible. Common reasons:
Submit
Always welcome 🤗
Downvoting a post can decrease pending rewards and make it less visible. Common reasons:
Submit
Hey bro I'm really glad coming across your wonderful article again just as normal he delivered such a interesting and lovely content I must like to say I've been loved to see such content okay
Yes it's true friend the crypto news and the new listings of steam into new exchanges caused drastic changes volatile ones to be precise that went upward or would I say in a bullish manner to help increase the price of steem in the crypto market
Thanks for sharing wishing you success please engage on my entry https://steemit.com/hive-108451/@starrchris/steemit-crypto-academy-contest-s14w2-volatility-in-cryptocurrencies
Downvoting a post can decrease pending rewards and make it less visible. Common reasons:
Submit
Thanks for your valuable comment .
Downvoting a post can decrease pending rewards and make it less visible. Common reasons:
Submit
Yes the sudden fluctuations in the prices of crypto currencies is referred as the volatility which sometimes remain useful i.e it opens more doors for investors to gain more profit. Sometimes it may also affect negativity. Yes the Bollinger bands indicator is very powerful indicator which determines the volatility of crypto currencies which you have also explained in the Steem/USDT chart. Thank you so much for sharing your insights with us.
Best of luck 🤞
Downvoting a post can decrease pending rewards and make it less visible. Common reasons:
Submit
Thanks for going through my post.
Downvoting a post can decrease pending rewards and make it less visible. Common reasons:
Submit