
Define Heikin-Ashi Technique in your own words.
Heikin-Ashi technique is a Japanese candlestick-based trading tool which was developed by Munehisa Homma in the 1700s to represent market price data using candlestick charts. This technique is similar to the traditional candlestick charts that we use in tracing except that the values are computed in candlesticks. Heikin-Ashi which means average bar is a trading technique that makes use of the mean price of the security.
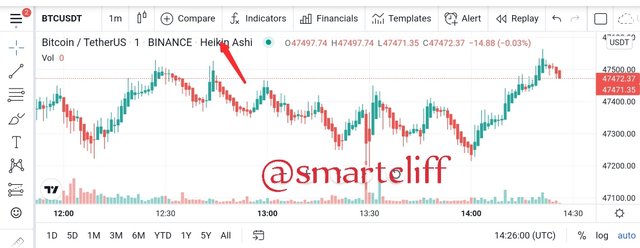
Basically, it is used to show the market trend signals and predict movement of prices by using average price data to filter out market noise.
The removal of the market noise leads to a clear illustration of the market movements and the direction in which the price is going. The Heikin-Ashi trading technique shows traders different points such as when to hold a trade, pause, or show if a reversal is about too happen. Hence, these traders can change your positions to suit themselves either by avoiding making losses or making good profits.
This technique is similar to the traditional candlestick charts that we use in tracing except that the values are computed in candlesticks. Traditional candlestick uses a modified formula that is based on two period averages rather than four (open, high, low and close prices). Consequently, Heikin-Ashi technique makes it easy too spot trends and reversals by generating a smoother chart and also obscuring price data and gaps.
Make your own research and differentiate between the traditional candlestick chart and the Heikin-Ashi chart. (Screenshots required from both chart patterns)
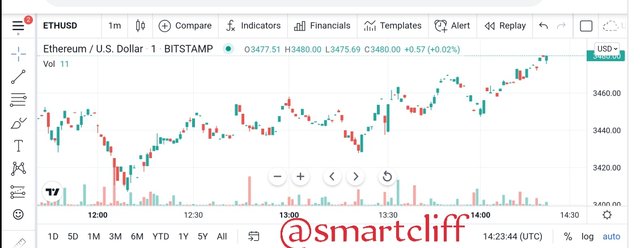
There are quite a number of differences between the traditional candlestick and the Heikin-Ashi candlestick. To practically show the difference, I'll be showing the two charts with the ETHUSD pair on 1D timeframe.
ETHUSD traditional chart using 1day time frame
ETHUSD Heikin-Ashi chart using 1day time frame
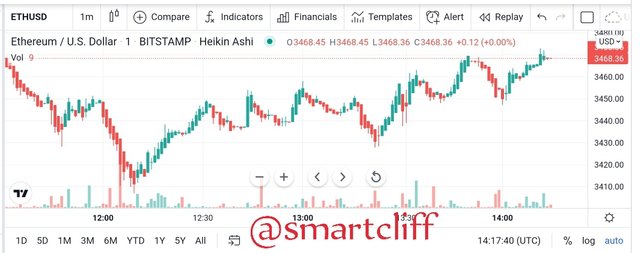
From the charts above, some differences can be picked out which are:
| Heikin-Ashi chart | Traditional candlestick |
|---|---|
| Heikin-Ashi has a smooth appearance and this is because it takes an average of the movement. The candles are likely to be red during a downtrend and green during an uptrend | Traditional candlestick charts change colour even when the price is dominantly moving in a certain direction. |
| Heikin-Ashi chart takes an average hence, the current price of an asset that is being traded in the market may not match with that on the candle. The price in the market matches that shown on the candlestick | The colours of candlesticks are shown dominantly which makes identification and interpretation of market movement trends possible. There is a frequently variation in the colour of the candlestick hence making interpretation difficult. |
| A new candlestick opens up in the middle of the previous because of theedthod of it's calculation | A new candlestick opens when the succeeding candlestick closes. |
Explain the Heikin-Ashi Formula. (In addition to simply stating the formula, you should provide a clear explanation about the calculation)
Heikin-Ashi Formula
In the Heikin-Ashi formular, the calculation is based on the open close data gotten from the previous period and the open high low close (OHLC) derived from the current period.
Below are the Heikin-Ashi calculation formulas:
Where:
HA = Heikin-Ashi
-1 = Previous period figures
0 = Current period figures
Heikin-Ashi formula explained
The data of this strategy or trading pattern (Heikin-Ashi) can be derived in various timeframes just as daily, weekly or monthly. It usually opens at the midpoint to where the former bar whereas the close is calculated as the mean/average price of the current bar.
Heikin-Ashi High: this is the highest value in the current high, the open and close.
Heikin-Ashi Low: this is the minimum value in the current low, the open as well as the close.
Heikin-Ashi close: there will be a combination of the high, low, open and close prices.
Heikin-Ashi Open: use the open and close prices in the previous period.

It is obvious that to continue computing the HA candles using the formula after the first Heikin-Ashi has been calculated is quite easy. All that is needed is to know the maximum and minimum, the open, close, high and low and you can accurately solve it. Use the former open and close to compute the next open. Choose the maximum of the present period's high or low ..or the current period's open or close to determine either high or low.
Remember that the Heikin-Ashi Open and close are calculated.
Graphically explain trends and buying opportunities through Heikin-Ashi Candles. (Screenshots required)
TREND
On the Heikin-Ashi candlestick charts, trends are very identifiable and interpreted due to how the candles look. It creates its candles by calculating the average figure which makes a smooth flow of the candlestick hence reducing market noise. In the trend here, the colours are moved in a certain direction with the current trend.
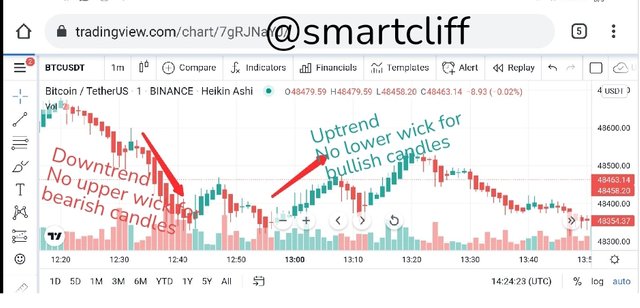
The Heikin-Ashi chart depicts the strength of a particular trend through it's shadows otherwise known as wick. For an uptrend, there is no lower wick in the candles while in the downtrend, there are no upper wicks. A bullish market shows green candle while a bearish market shows a red candle.
There is an uptrend, downtrend and indecision.
Uptrend: refers to a formation of an upward candlestick with an upper shadow in a bearish market.
Downtrend: refers to a downward candlestick with a lower shadow in a bullish market.
Indecision: refers to a candlestick with the two shadows, a short body and a colour that follows the preceeding candles which shows the beginning of the correction.
An illustration is shown in the chart below
Buying орроrtunitу
A green ascending candlestick with a long body, an upper shadow without a lower shadow shows the beginning or continuation of an uptrend. With the use of Heikin-Ashi candlestick, a trader can know trading opportunities or signals. It shows candles with upper wicks to signify a bullish market and those with lower wicks to signify a bearish market. Although, there are some candles known as indecisive candles which show good opportunities for trading. If there is a strong bullish candle preceeding an indecisive candlestick, it can mean a buy signal whereas a strong bearish candle means a sell signal.
An illustration is shown below
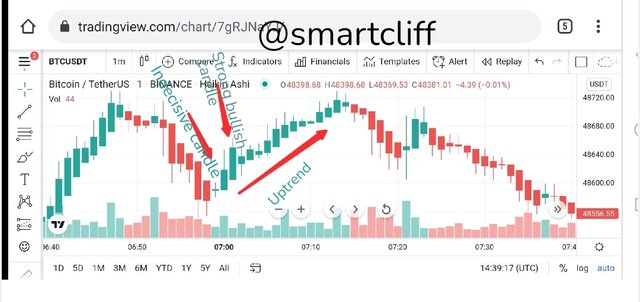
The strong bullish candles was seen after an indecisive candle and traders can see the points after the bullish candle as an opportunity to buy.
Is it possible to transact only with signals received using the Heikin-Ashi Technique? Explain the reasons for your answer.
Yes, it is very possible to transact using only with signals received using the Heikin-Ashi Technique. It occurs when the trader understands how it works and how to interpret it. The said technique is used in spotting trends, predicting movement of price and reversals and all these things are what is checked neofroe making a decision to trade. More so, it filters the market noise and hence, a trader will likely know the signals for long or short if he understands and knows how to interpret the technique.
A green candle without a lower wick means an bullish trend and the trader is signalled to long whereas red candles with no upper wick means a bearish trend and that means that the trader should do a short transaction. It is important to have other means of confirmation before starting a trade and some traders use indicators such as EMA, RSI, Ichimoku, MA etc. Most price action traders do not need an indicator but make do with the data gotten from the candles in Heikin-Ashi using OHLC to know when to long or short.
Personally, I refer using the data gotten from the candlestick to influence my trading decisions and it is very possible to transact using only signals from Heikin-Ashi technique.
By using a Demo account, perform both Buy and Sell orders using Heikin-Ashi+ 55 EMA+21 EMA.
I was unable to use a demo account to perform either of the tasks...I hope you can recommend one.
Conclusion
Overall, Heikin-Ashi technique makes use of the average price to create candles and is used in the identification and interpretation of the direction and strength of trends.
It is used in collaboration with other indicators such as RSI and Ichimoku to give accurate trading signals. In addition, it provides better trade signals on the long-run but does not guarantee the success of any transactions as only signals are given.
All screenshots are gotten from tradingview unless otherwise stated.
Cc: @reddileep

@tipu curate
Downvoting a post can decrease pending rewards and make it less visible. Common reasons:
Submit
Upvoted 👌 (Mana: 3/8) Get profit votes with @tipU :)
Downvoting a post can decrease pending rewards and make it less visible. Common reasons:
Submit
Thank u sir
Downvoting a post can decrease pending rewards and make it less visible. Common reasons:
Submit